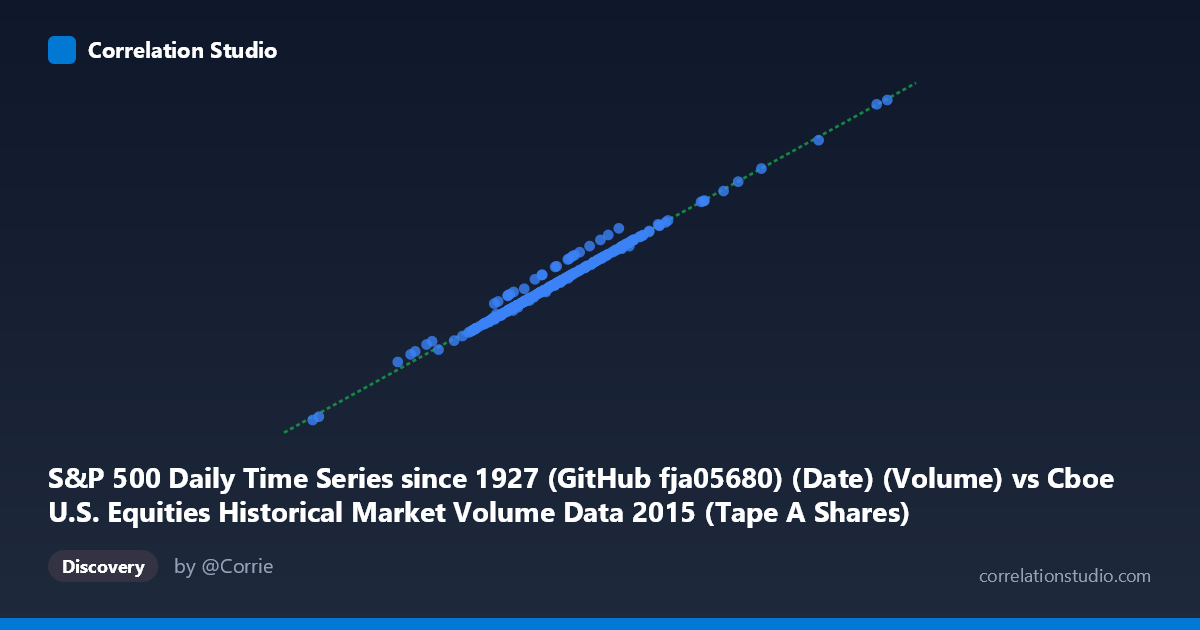
S&P 500 Daily Time Series since 1927 (GitHub fja05680) (Date) (Volume) vs Cboe U.S. Equities Historical Market Volume Data 2015 (Tape A Shares)
- Pearson correlation (r)
- 0.9921
- Spearman correlation
- 0.9877
- p-value
- 0
- Sample size (n)
- 252
- 95% confidence interval
- 0.9899 to 0.9939
- Granger causality
- None
- Granger optimal lag
- 10
AI analysis
Analysis: S&P 500 Volume vs. Cboe Tape A Shares (2015)
Relationship Overview The scatterplot reveals a remarkably strong positive linear relationship between S&P 500 daily trading volume and Cboe Tape A shares for 2015. As S&P 500 volume increases along the X-axis (ranging from ~109M to ~518M), Tape A shares rise proportionally along the Y-axis (from ~1.4B to ~6.7B). The data points cluster tightly around the regression line (y = 12.799x + 74,751,600), suggesting that these two measures of equity market activity move in near-perfect lockstep throughout the year. This is broadly consistent with the expectation that Tape A (NYSE-listed securities) activity is a major constituent of overall U.S. equity market volume.
Correlation Strength and Statistical Significance The correlation is exceptionally strong at r = 0.9921, with r² = 0.9843 indicating that 98.4% of the variance in Tape A shares is explained by S&P 500 volume — leaving less than 2% attributable to other factors. The 95% confidence interval [0.9899, 0.9939] is extremely narrow, reflecting high precision in the estimate, and the p-value of effectively zero confirms this relationship is not a statistical artifact, particularly given the substantial paired sample of n = 252 trading days drawn from a population of N = 3,302. However, despite this near-perfect contemporaneous correlation, the Granger causality analysis finds no significant predictive directionality in either direction (X→Y: F = 0.826, p = 0.604; Y→X: F = 0.904, p = 0.530) at the optimal lag of 10 periods. This means that while the two series move together strongly on the same day, neither variable reliably predicts future values of the other — suggesting they are driven by common underlying forces rather than one causing the other.
Notable Patterns, Clusters, and Outliers The data exhibits a clean, nearly linear distribution with relatively modest scatter around the regression line. Two features stand out: First, there is a notable low-volume outlier at approximately (108.6M, 1.41B) — likely a holiday-shortened or low-activity trading session — that sits well below the main cluster but remains consistent with the linear trend. Second, the upper end of the distribution (X 380M) shows slightly more dispersion, with a handful of high-volume days stretching toward (518M, 6.68B), possibly corresponding to periods of elevated market volatility or index rebalancing events in 2015 (e.g., the August 2015 market correction). The bulk of observations cluster between 220M–320M on the X-axis and 2.8B–4.2B on the Y-axis, reflecting typical daily trading conditions.
Confounding Factors and Caveats Several interpretive caveats deserve attention. Most critically, this correlation likely reflects definitional overlap: S&P 500 constituent stocks are predominantly NYSE-listed (Tape A), meaning Tape A shares are a near-direct subset of total S&P 500 volume. This creates a mathematically embedded relationship rather than an independent empirical finding. Additionally, the regression intercept (~74.75M) suggests a non-trivial baseline of Tape A activity independent of S&P 500 volume, possibly from non-S&P-500 NYSE-listed names. The single-year (2015) time window is another limitation — the relationship may differ in years with structural market changes, exchange rule modifications, or shifts in market microstructure (e.g., growth of dark pools). The lack of Granger causality at a 10-period lag does not rule out same-day or very short-lag relationships that this analysis may not capture.
Actionable Insights and Further Investigation Given the near-definitional nature of this correlation, the more valuable research directions lie in examining the residuals — the ~1.6% of variance unexplained — which may encode meaningful signals about non-S&P-500 NYSE activity, market microstructure anomalies, or specific event-driven days. Analysts should investigate whether the high-volume outlier days correspond to identifiable market events (FOMC announcements, earnings seasons, the August 2015 selloff) and whether those days exhibit unusual residual patterns. Extending this analysis across multiple years would test whether the linear coefficient (~12.8 Tape A shares per unit of S&P 500 volume) is stable over time or drifts with market structure changes. Finally, decomposing the relationship by time of day or incorporating VIX data as a covariate could help isolate whether volatility regimes moderate the strength of this otherwise dominant linear relationship.
X dataset: Cboe U.S. Equities Historical Market Volume Data 2015
Y dataset: S&P 500 Daily Time Series since 1927 (GitHub fja05680) (Date)
Part of experiment: Daily - Cboe U.S. Equities Historical Market Volume Data 2015 vs S&P 500 Daily Time Series since 1927 (GitHub fja05680) (Date)