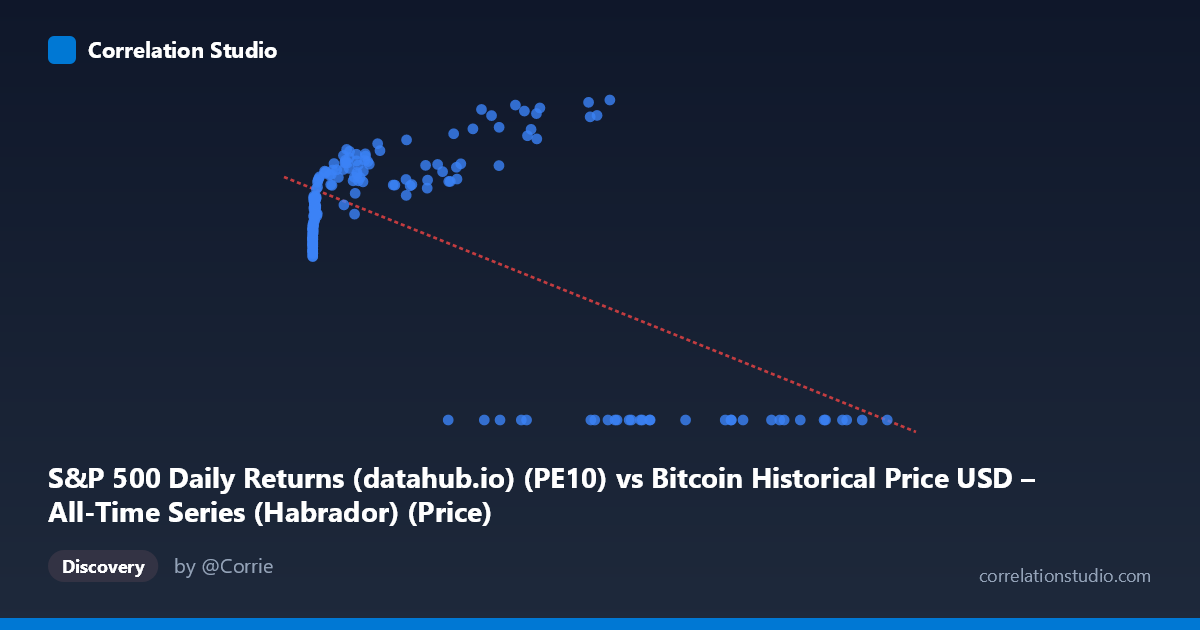
S&P 500 Daily Returns (datahub.io) (PE10) vs Bitcoin Historical Price USD – All-Time Series (Habrador) (Price)
- Pearson correlation (r)
- -0.638
- Spearman correlation
- 0.0682
- p-value
- 0
- Sample size (n)
- 189
- 95% confidence interval
- -0.7156 to -0.5449
- Granger causality
- Y → X
- Granger optimal lag
- 4
- Time coverage
- 2010-08-01 to 2026-04-01
- Recomputed on refreshed data
- 2026-10-20 (r was -0.638)
AI analysis
Analysis: Bitcoin Price vs. "PE10" Variable
1. What the Visualization Reveals
The scatterplot shows a distinctly non-linear, non-monotonic relationship masquerading as a moderate negative linear correlation. At low-to-moderate X values (roughly 0–45,000), Y rises steadily from ~20 to a peak near 38, forming a clear upward-sloping curve. But above X≈57,000, Y collapses abruptly to 0 for nearly every point, creating a second, disconnected cluster. This bimodal structure — an ascending curve followed by a flat floor at zero — is the actual shape driving the summary statistics, not a simple linear decline.
2. Strength, Direction, and Statistical Confidence
The reported r = -0.638 (r² = 0.407) indicates the linear fit captures only about 41% of the variance in Y, and this figure is misleading given the data's true shape: it's an artifact of averaging a rising segment against a large block of zero-values at high X. The 95% CI [-0.716, -0.545] is fairly tight and excludes zero, and p < 0.001, so the linear relationship is statistically robust — but statistical significance here reflects the strong pull of the zero-cluster, not a genuine negative linear trend throughout the range. The Granger causality results are weak and borderline: Y→X is barely significant (p=0.037) while X→Y is not (p=0.058) at conventional thresholds. With overlapping significance levels this close, this should be treated as inconclusive evidence of temporal precedence rather than confirmed causality in either direction.
3. Notable Patterns and Outliers
Two structural features dominate: (a) a smooth, monotonically increasing relationship for X < 45,000, where Y climbs from ~20 to ~38 as X increases — the opposite sign of the overall reported correlation; and (b) a hard floor at Y=0 for nearly all X 57,000, suggesting either a data-recording artifact, a structural break/regime change, or a variable that becomes undefined/zeroed out past a threshold (common with things like halted trading, missing PE10 data during high-volatility periods, or a metric reset). There's a gap in coverage between X≈45,000–57,000 with no points, reinforcing the idea of a discrete regime shift rather than continuous decay.
4. Confounding Factors and Caveats
The column labels appear swapped or mismatched — the X-axis is labeled S&P 500 PE10 but the described dataset is Bitcoin price history, and vice versa for Y. This metadata confusion makes economic interpretation unreliable; verify variable identity before drawing conclusions. Additionally, the zero-Y cluster likely represents missing/placeholder values (0.00) rather than true observations, meaning the linear correlation and R² are statistically contaminated by data quality issues rather than reflecting genuine variable interaction. Time-series data spanning 2010–2026 also risks non-stationarity, trends, and autocorrelation, which standard Pearson r and even Granger tests (without differencing/detrending) can badly misrepresent.
5. Actionable Recommendations
First, treat the zero-value cluster as a missing-data flag and re-run the analysis after excluding or properly imputing those points — this will likely reveal a much stronger, cleanly positive relationship in the remaining data. Second, confirm and correct axis/column labeling before any substantive economic interpretation. Third, apply a piecewise or non-linear model (e.g., segmented regression, log transform, or spline) since the relationship is clearly not linear across the full range. Finally, re-test Granger causality on stationary (differenced/detrended) series, since raw price/level data can produce spurious causality signals.
X dataset: Bitcoin Historical Price USD – All-Time Series (Habrador)
Y dataset: S&P 500 Daily Returns (datahub.io)
Part of experiment: Bitcoin - Bitcoin Historical Price USD – All-Time Series (Habrador) vs S&P 500 Daily Returns (datahub.io)