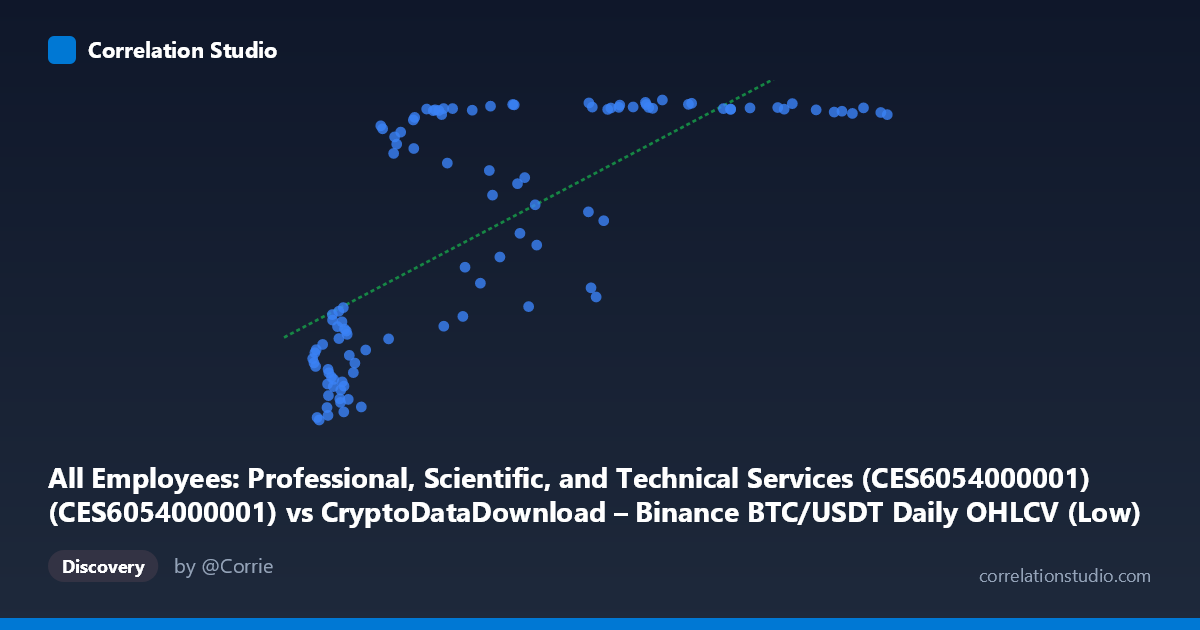
All Employees: Professional, Scientific, and Technical Services (CES6054000001) (CES6054000001) vs CryptoDataDownload – Binance BTC/USDT Daily OHLCV (Low)
- Pearson correlation (r)
- 0.7263
- Spearman correlation
- 0.8095
- p-value
- 0
- Sample size (n)
- 106
- 95% confidence interval
- 0.6217 to 0.8055
- Granger causality
- None
- Granger optimal lag
- 10
AI analysis
Analysis: BTC/USDT Price vs. Professional Services Employment
1. Relationship Overview
The scatterplot displays a clear non-linear, saturating relationship rather than a simple linear one. At low X-values (roughly 3,400–20,000), Y rises steeply from ~9,100 to ~10,600 — a very sharp climb. Beyond X≈40,000, Y plateaus tightly between 10,750 and 10,820, essentially independent of further X increases (even out to X=113,966). This "logarithmic" or "hockey-stick" shape means a straight-line fit captures only part of the true structure, despite reporting statistically significant correlation.
2. Strength, Direction, and Statistical Caveats
The Pearson r = 0.723 indicates a strong positive linear association, with r² = 0.523 meaning the linear model explains about 52% of Y's variance — leaving nearly half unexplained, largely due to the curvature described above. The 95% CI [0.617, 0.804] is reasonably tight and excludes zero, and p≈0 confirms the correlation is not due to chance in this sample. However, Granger causality tests show no significant predictive direction in either direction (X→Y: p=0.58; Y→X: p=0.58) at the optimal 10-period lag. This is a critical caveat: despite the strong contemporaneous correlation, neither series helps forecast the other's future values — the relationship is likely driven by a shared trend or common external factor rather than one variable causally leading the other.
3. Notable Patterns and Outliers
The data cleanly separates into two regimes: a "low-X/low-Y" cluster (X < 20,000, Y in 9,100–9,700) representing early observations, and a "high-X/high-Y" cluster (X 40,000, Y 10,000) representing later observations, with a narrow transition zone between them (X≈20,000–45,000, where Y ranges widely from 9,600 to 10,800). Notably, a few points break the monotonic pattern — e.g., (44,950, 9,710) and (46,512, 10,045) sit well below neighboring points at similar X values with Y near 10,800, suggesting short-term volatility or noise in this transition band rather than a smooth function.
4. Confounding Factors and Caveats
This pairing is econometrically unusual: BTC/USDT daily price (X) is matched against monthly professional-services employment (Y), meaning temporal resolution mismatch (daily vs. monthly, aggregated to 105 paired points) likely smooths and distorts true dynamics. Both series plausibly share a common confound — time itself, since both crypto valuations and employment have trended upward over 2017–2026 (post-COVID recovery, secular BTC bull market, low-rate era). This is a classic spurious correlation via shared trend/non-stationarity rather than genuine economic linkage; neither series is likely to structurally depend on the other (there's no clear economic mechanism linking BTC price to professional-services hiring).
5. Recommendations
Before drawing causal or predictive conclusions: (a) de-trend or difference both series (e.g., % change month-over-month) and re-test correlation to check if it persists after removing shared trend — it likely will collapse toward zero; (b) fit a non-linear model (log or logistic) to better capture the saturating shape and improve variance explained; (c) given the null Granger result, avoid using BTC price as a leading indicator for employment forecasts or vice versa; (d) investigate whether both series are cointegrated with a third macro variable (e.g., Fed policy rate, overall labor market index, or risk-asset sentiment) that may better explain the co-movement.
X dataset: CryptoDataDownload – Binance BTC/USDT Daily OHLCV
Y dataset: All Employees: Professional, Scientific, and Technical Services (CES6054000001)
Part of experiment: Bitcoin - CryptoDataDownload – Binance BTC/USDT Daily OHLCV vs All Employees: Professional, Scientific, and Technical Services (CES6054000001)