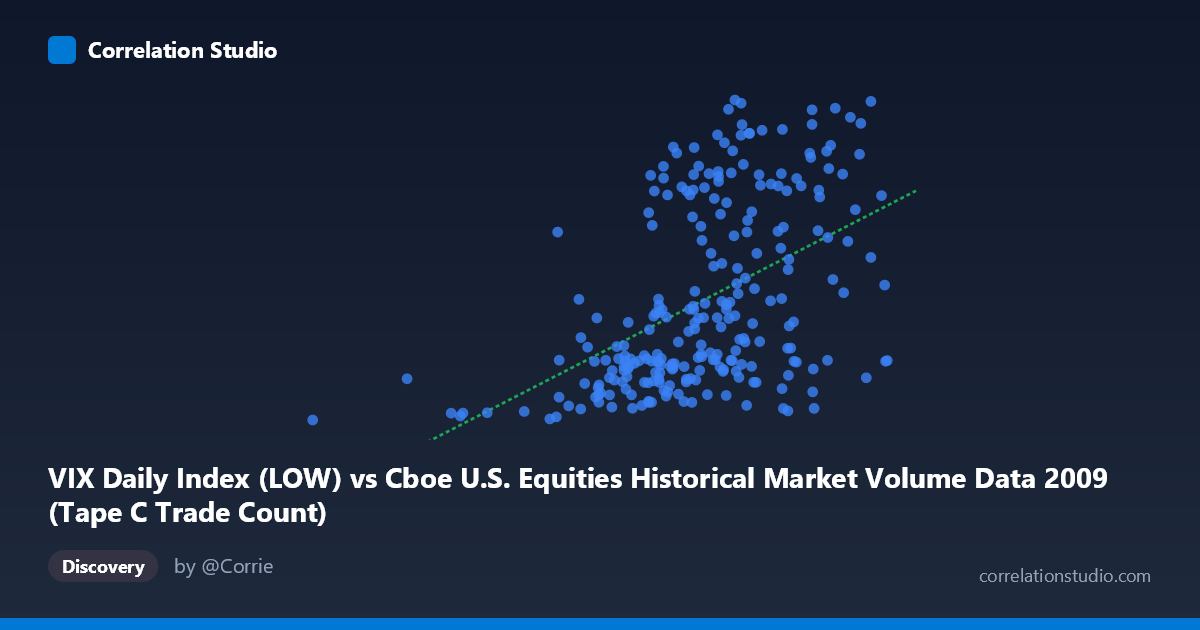
VIX Daily Index (LOW) vs Cboe U.S. Equities Historical Market Volume Data 2009 (Tape C Trade Count)
- Pearson correlation (r)
- 0.486
- Spearman correlation
- 0.5183
- p-value
- 0
- Sample size (n)
- 252
- 95% confidence interval
- 0.3855 to 0.575
- Granger causality
- None
- Granger optimal lag
- 1
AI analysis
Analysis: VIX Daily Index (Low) vs. Tape C Trade Count (2009)
Relationship Overview The scatterplot reveals a moderate positive relationship between the VIX Daily Index Low values and Cboe U.S. Equities Tape C Trade Count during 2009. As the VIX low values increase — indicating elevated baseline volatility — Tape C trade counts tend to rise as well. This is consistent with the well-established market microstructure phenomenon where heightened uncertainty drives increased trading activity across equity exchanges. The linear regression equation (y = 4.18289E-05x + 3.877) suggests a relatively shallow but meaningful slope across the observed X range of approximately 185,887 to 848,554.
Correlation Strength and Statistical Significance The Pearson correlation of r = 0.486 indicates a moderate positive association, but the coefficient of determination (r² = 0.2362) is the more sobering metric: only 23.6% of the variance in Tape C Trade Count is explained by VIX Low values, leaving over three-quarters of variation attributable to other factors. The 95% confidence interval of [0.386, 0.575] is meaningfully bounded above zero, and the p-value of 2.22E-16 confirms the result is highly statistically significant given the sample size of n = 252 drawn from a population of N = 3,232. However, statistical significance here is partly a function of sample size rather than effect magnitude — the relationship is real but far from deterministic. Critically, Granger causality testing finds no significant predictive directionality in either direction (X→Y: F = 0.395, p = 0.530; Y→X: F = 0.034, p = 0.855), meaning that past VIX low values do not reliably predict future trade counts, and vice versa, at the tested lag of 1 period. The correlation reflects co-movement, not temporal precedence.
Notable Patterns, Clusters, and Outliers The scatterplot displays a distinct bimodal or stratified clustering pattern rather than a smooth linear spread. A dense cluster of points congregates at lower X values (roughly 500,000–700,000) with Y values predominantly between 20–30, while a second, more dispersed cluster occupies higher X values with Y values ranging from 35–49. This bifurcation likely reflects the two distinct volatility regimes of 2009: the crisis-elevated early-year period (post-Lehman aftermath through March 2009 lows) versus the recovery and stabilization phase of mid-to-late 2009. Several notable outliers are visible — particularly the point near (185,887; 19.25), which sits far left and low, and points near (806,023; 47.65) and (761,868; 48.35), which represent extreme combinations of high volume and high volatility. The point at (848,554; ~32) appears anomalous, showing very high X but only moderate Y, potentially representing a high-volume day without corresponding VIX elevation.
Confounding Factors and Caveats Several important caveats complicate causal interpretation. 2009 was a structurally atypical year — spanning a market crisis nadir (March 2009 S&P 500 bottom) through a sharp recovery rally, creating regime-dependent dynamics that may not generalize. The dataset conflates two fundamentally different market environments within a single correlation, which can artificially inflate or distort the measured r value. Additionally, Tape C specifically captures NYSE Arca-listed securities (predominantly ETFs and tech-adjacent equities), which may respond to volatility differently than Tape A or B issues. The VIX "Low" column represents the intraday low rather than close or open, introducing a timing mismatch when compared against full-day trade count aggregates. Reverse causality or common-cause confounding (e.g., macroeconomic news events simultaneously driving both VIX and volume) cannot be ruled out, and the absence of Granger causality reinforces that the relationship is likely driven by shared contemporaneous drivers rather than lead-lag dynamics.
Actionable Insights and Further Investigation Practitioners should avoid using VIX low values alone as a predictive signal for Tape C trade volume given the lack of Granger causality and the limited explanatory power (23.6%). More productive next steps would include: (1) regime-segmenting the analysis by splitting 2009 into pre- and post-March 2009 subperiods to test whether the correlation is regime-dependent; (2) incorporating additional predictors such as VIX open/close spread (intraday range), S&P 500 daily returns, and macroeconomic announcement calendars to build a more complete volume model; (3) testing non-linear specifications (e.g., logarithmic or piecewise regression) given the apparent clustering pattern, which suggests a linear model may be underspecifying the true relationship; and (4) extending the Granger causality test to longer lag structures (e.g., 2–5 periods) to check whether any delayed predictive relationship exists at weekly horizons. Cross-year validation against 2008 and 2010 data would also help determine whether this moderate correlation is a durable structural feature or an artifact of 2009's unique volatility environment.
X dataset: Cboe U.S. Equities Historical Market Volume Data 2009
Y dataset: VIX Daily Index
Part of experiment: Daily - Cboe U.S. Equities Historical Market Volume Data 2009 vs VIX Daily Index