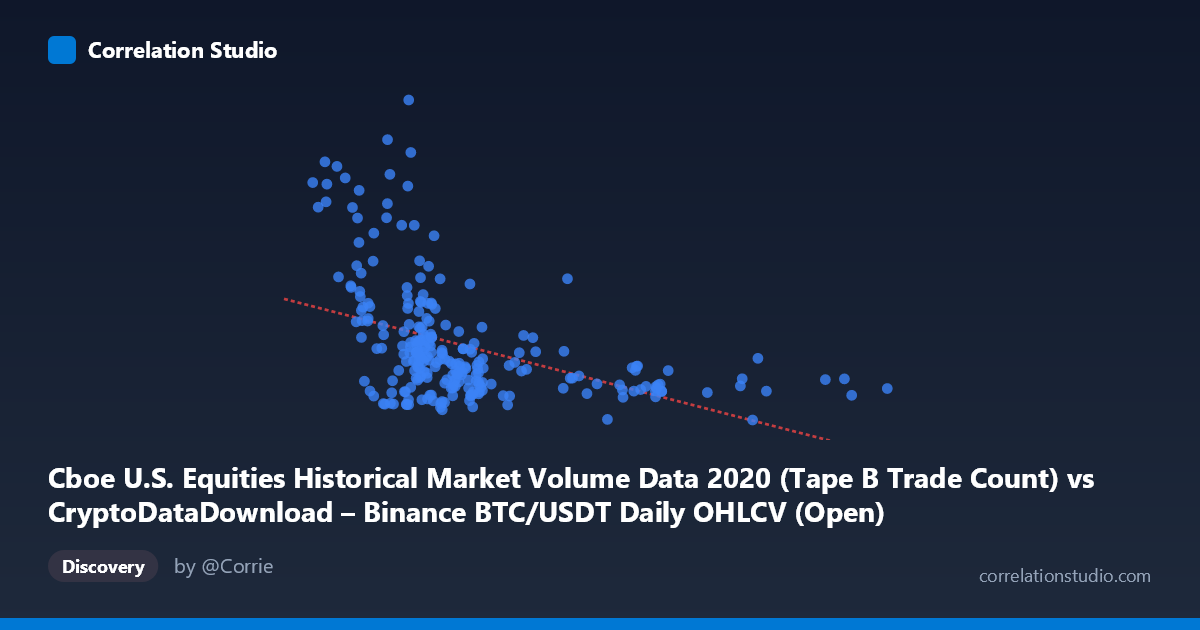
Cboe U.S. Equities Historical Market Volume Data 2020 (Tape B Trade Count) vs CryptoDataDownload – Binance BTC/USDT Daily OHLCV (Open)
- Pearson correlation (r)
- -0.4449
- Spearman correlation
- -0.5308
- p-value
- 0
- Sample size (n)
- 253
- 95% confidence interval
- -0.5387 to -0.3403
- Granger causality
- None
- Granger optimal lag
- 10
AI analysis
Analysis: Cboe Trade Count vs. Binance BTC/USDT Open Price
1. What the Visualization Reveals
The scatterplot shows a moderate negative relationship between Cboe U.S. equities trade count (X-axis) and Binance BTC/USDT opening price (Y-axis) across 253 paired daily observations from 2020. The data reveals a dense cluster of points at lower X-values (roughly 6,000–12,000 trade counts) spanning a wide range of Y-values (170K–1.2M), with a sparser tail of higher X-values (15,000–29,000) that consistently correspond to lower, more compressed Y-values (250K–650K). This creates a visual pattern where the negative slope is driven partly by this asymmetric distribution rather than a uniform linear trend throughout the range.
2. Strength, Direction, and Statistical Confidence
The correlation coefficient (r = -0.4449) indicates a moderate negative linear relationship, but r² = 0.1979 shows that only about 20% of the variance in one variable is explained by the other — leaving 80% attributable to other factors. The 95% CI [-0.5387, -0.3403] is reasonably tight and excludes zero, and the p-value (1.057E-13) confirms this correlation is highly statistically significant and not due to chance. However, statistical significance with a large-ish sample should not be conflated with practical predictive strength — this is a weak-to-moderate relationship, not a tight coupling. Critically, the Granger causality tests show no significant predictive direction in either direction (X→Y: p=0.715; Y→X: p=0.161), meaning that despite the contemporaneous correlation, neither variable's past values help forecast the other's future values at daily lags up to 10 periods. This strongly suggests the correlation is likely driven by a shared external factor or coincidental trending rather than genuine causal/predictive linkage.
3. Notable Patterns and Outliers
Several extreme outliers stand out, particularly points like (8823.25, 1,222,154) and (5816.05, 1,003,994) — these represent unusually high BTC prices paired with modest trade counts, likely corresponding to the December 2020 BTC bull run when price surged independent of equity market activity. Conversely, the high-X cluster (X 15,000) shows remarkably low variance in Y, suggesting these dates (possibly high-volatility equity trading days, perhaps March 2020 COVID crash volume spikes) coincided with a calmer, range-bound period in BTC price. This bifurcated structure — tight clustering at high X, wide dispersion at low X — hints at heteroscedasticity, which can inflate or distort a simple linear r² estimate and suggests the true relationship may be non-linear or regime-dependent.
4. Confounding Factors and Caveats
Both series are time-ordered financial data from 2020, a year marked by major macro shocks (COVID crash, unprecedented monetary stimulus, retail trading boom) that could independently drive both equity trading volume and BTC prices upward without one causing the other — a classic confounding-by-common-cause scenario. Additionally, comparing a count metric (trades) to a price level (not return) risks spurious correlation from shared trends/non-stationarity — neither series is differenced or detrended, and BTC's strong 2020 uptrend alone could produce artificial correlation with any other time-indexed series. The population (N=3,212) vs. sample (n=253) discrepancy also warrants scrutiny — understanding how these 253 dates were selected (e.g., trading day alignment, missing-data handling) is essential before trusting the estimate as representative.
5. Actionable Insights and Further Investigation
Given the lack of Granger causality, this correlation should not be used for predictive trading signals in either direction. Instead, analysts should: (1) re-run the analysis on returns/percentage changes rather than raw levels to remove trend-driven spurious correlation and test for stationarity (ADF test) first; (2) investigate whether a third variable (e.g., VIX, overall market liquidity, USD strength) better explains the co-movement; (3) segment the analysis by sub-periods (pre/post-COVID crash, Q4 rally) to check if the relationship is regime-specific rather than constant across 2020; and (4) examine the extreme outliers directly to confirm whether they're legitimate data or artifacts (e.g., a data entry/timestamp misalignment for the 1.22M Y-value point) before drawing further conclusions.
X dataset: CryptoDataDownload – Binance BTC/USDT Daily OHLCV
Y dataset: Cboe U.S. Equities Historical Market Volume Data 2020
Part of experiment: Bitcoin - CryptoDataDownload – Binance BTC/USDT Daily OHLCV vs Cboe U.S. Equities Historical Market Volume Data 2020