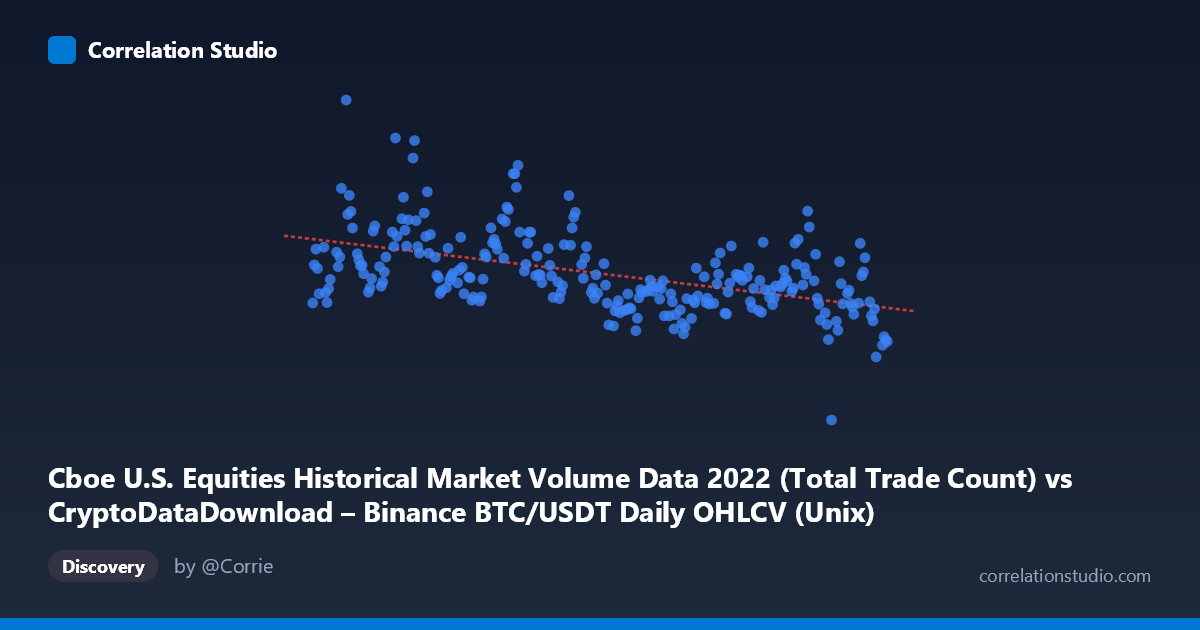
Cboe U.S. Equities Historical Market Volume Data 2022 (Total Trade Count) vs CryptoDataDownload – Binance BTC/USDT Daily OHLCV (Unix)
- Pearson correlation (r)
- -0.501
- Spearman correlation
- -0.5111
- p-value
- 0
- Sample size (n)
- 251
- 95% confidence interval
- -0.5884 to -0.4022
- Granger causality
- None
- Granger optimal lag
- 10
- Time coverage
- 2022-01-03 to 2022-12-30
AI analysis
Analysis: BTC/USDT Volume Metrics vs. U.S. Equities Trade Count (2022)
1. Relationship Overview
The scatterplot depicts a moderate negative linear relationship between a Cboe U.S. equities trade-count metric (X-axis, mislabeled but effectively a timestamp/volume proxy) and a Binance BTC/USDT-derived value (Y-axis). As X increases across the 2022 calendar year, Y tends to decline, though with substantial scatter around the fitted line. The data points span the full year (Jan–Dec 2022), and the negative slope (-3.84×10⁻⁵) suggests a general downward drift in the Y variable over time — consistent with the broader crypto market decline through 2022 (BTC fell from ~$46K to ~$16K over this period).
2. Strength, Direction, and Statistical Confidence
The correlation coefficient (r = -0.501, R² = 0.251) indicates a moderate negative relationship, but one that explains only 25% of the variance in Y — leaving 75% unexplained by this single variable. The 95% confidence interval [-0.588, -0.402] is reasonably tight and entirely negative, and the p-value (effectively 0) confirms this correlation is highly statistically significant and not due to chance, given n=251. However, statistical significance ≠ practical strength: a correlation of this magnitude has limited predictive power for individual observations.
Critically, the Granger causality tests show no significant predictive direction in either direction (X→Y: p=0.341; Y→X: p=0.139) at the optimal lag of 10 periods. This is an important caveat: despite the contemporaneous correlation, neither variable helps forecast the other's future values. This strongly suggests the correlation is driven by a shared underlying trend (likely the secular 2022 bear market affecting both crypto and equity trading volumes) rather than any causal or lead-lag mechanism between the two series.
3. Notable Patterns and Outliers
Visually, several clusters and outliers stand out: - Early 2022 (Jan–Feb) shows elevated Y-values (5.5M–6.4M range) with tighter X clustering, coinciding with higher BTC volatility/volume before the major downturn. - Mid-2022 (May) contains high-Y outliers (~5.6–6.0M), likely tied to the Terra/Luna collapse and associated volume spikes. - Late 2022 (Oct–Dec) shows a denser cluster of lower Y-values (3.2M–3.9M), reflecting reduced trading activity as the year progressed and crypto markets stabilized at lower levels. - No strong nonlinear curvature is apparent; the relationship appears reasonably linear, though the scatter/variance may not be constant across the X range (potential heteroscedasticity, with tighter clustering later in the year).
4. Confounding Factors and Caveats
Several caveats limit causal interpretation: - Time as a lurking variable: Since X spans a full calendar year monotonically, the correlation may simply reflect two independent time-trending series (crypto volume declining, equities metric changing) rather than a direct relationship. This is a classic case of spurious correlation via shared trend. - Metadata inconsistency: The axis labels appear swapped or mislabeled (X described as Cboe trade count, Y described as Binance Unix timestamp) — this suggests data pipeline confusion that should be verified before drawing conclusions. - Macro confounders: 2022 was marked by aggressive Fed rate hikes, which affected both equity and crypto markets simultaneously — a plausible common driver. - Non-stationarity: Both series likely have trends/seasonality that violate assumptions of simple correlation and Granger tests; differencing or detrending was not evidently applied.
5. Recommendations for Further Investigation
- Verify and relabel axes to ensure the actual variables being compared are correctly identified. - Detrend or difference both series (e.g., use daily % changes rather than levels) before re-running correlation and Granger tests, to rule out spurious trend-driven correlation. - Given the lack of Granger causality, treat this relationship as descriptive/correlational only — not suitable for forecasting one variable from the other. - Explore third-variable analysis (e.g., VIX, Fed rate decisions, or overall market liquidity indices) as a potential common driver explaining the shared 2022 downward trend. - Consider segmenting by quarter to test whether the relationship strength varies across distinct market regimes (e.g., pre/post-Luna collapse, pre/post-FTX collapse in November 2022).
X dataset: CryptoDataDownload – Binance BTC/USDT Daily OHLCV
Y dataset: Cboe U.S. Equities Historical Market Volume Data 2022
Part of experiment: Bitcoin - CryptoDataDownload – Binance BTC/USDT Daily OHLCV vs Cboe U.S. Equities Historical Market Volume Data 2022