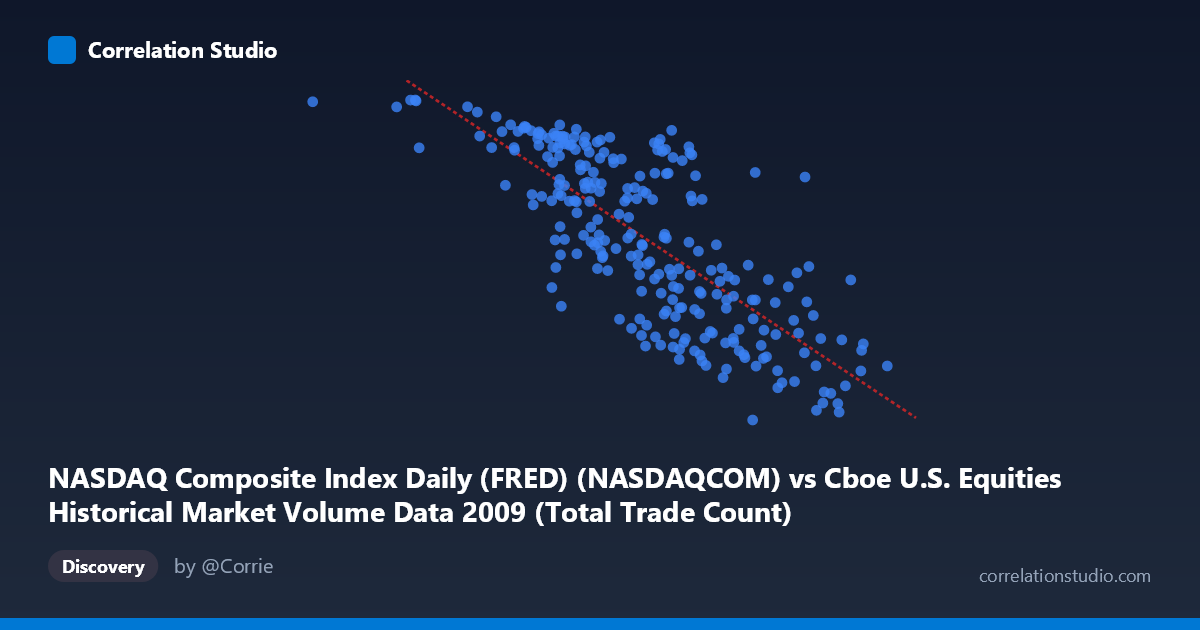
NASDAQ Composite Index Daily (FRED) (NASDAQCOM) vs Cboe U.S. Equities Historical Market Volume Data 2009 (Total Trade Count)
- Pearson correlation (r)
- -0.769
- Spearman correlation
- -0.7778
- p-value
- 0
- Sample size (n)
- 252
- 95% confidence interval
- -0.8152 to -0.7133
- Granger causality
- None
- Granger optimal lag
- 10
AI analysis
Analysis: NASDAQ Composite Index vs. Cboe U.S. Equities Total Trade Count (2009)
Relationship Overview
The scatterplot reveals a moderately strong negative relationship between the NASDAQ Composite Index level and the total trade count on U.S. equities exchanges throughout 2009. As the NASDAQ index rises in value, the number of individual trades tends to decrease — a pattern that runs counter to naive intuition that bull markets drive more trading activity. The linear regression equation (y = −0.00034702x + 2770.9) confirms this inverse slope, meaning that for every 1,000-point increase in the NASDAQ, the total trade count is expected to decline by approximately 347 units. This relationship reflects a well-documented market microstructure phenomenon: during periods of market stress and low prices (early 2009 post-crisis), fragmented, high-frequency, panic-driven trading inflates trade counts, while recovering markets consolidate into fewer but potentially larger transactions.
Correlation Strength and Statistical Significance
The correlation coefficient of r = −0.769 indicates a strong negative association, and the R² of 0.591 means that approximately 59.1% of the variance in total trade count is explained by the NASDAQ index level — a substantial explanatory share for financial time series data. The 95% confidence interval [−0.815, −0.713] is relatively narrow and lies entirely in negative territory, providing strong statistical confidence that this inverse relationship is genuine and not a sampling artifact. The p-value of effectively zero (p ≈ 0) confirms the result is highly statistically significant across the full population of N = 3,232 observations, with the paired sample of n = 252 providing robust coverage of the 2009 trading year. However, the Granger causality tests yield no significant directional predictability in either direction (X→Y: F = 1.77, p = 0.067; Y→X: F = 1.60, p = 0.107), both narrowly missing conventional significance thresholds at lag = 10 periods. This is a critical nuance: while the contemporaneous correlation is strong, neither variable reliably predicts the other's future values, suggesting the relationship is largely coincident rather than causal — both likely driven by common underlying macroeconomic forces.
Notable Patterns, Clusters, and Outliers
Several structural features stand out in the sample data. There is a visible cluster of high trade counts (above ~2,100) concentrated at lower NASDAQ values (roughly 629,671 to ~2,200,000), consistent with the turbulent, high-volume early-2009 market environment when the index was near its financial-crisis trough. Conversely, data points at higher NASDAQ values (above ~3,500,000) cluster tightly at lower trade counts (approximately 1,300–1,750), reflecting the calmer, recovering market of mid-to-late 2009. Two points warrant particular attention as potential outliers: the observation at X ≈ 629,671 (Y ≈ 2,285.69) and X ≈ 1,255,522 (Y ≈ 2,291.28) represent the extreme low end of the index with near-maximum trade counts, likely corresponding to the most distressed trading days around the March 2009 market bottom. At the upper extreme, X ≈ 4,134,003 (Y ≈ 1,441) anchors the high-index, low-trade-count end. The relationship also appears to exhibit slight non-linearity, with the negative slope potentially steepening at lower index values and flattening somewhat at higher values, suggesting a diminishing-returns or threshold dynamic that a simple linear model may underfit.
Confounding Factors and Interpretation Caveats
Several important confounds complicate a straightforward causal interpretation. Temporal autocorrelation is almost certain in daily financial data — both series carry momentum and trend through 2009, meaning much of the correlation may reflect shared time-trending rather than a direct structural link. The post-financial-crisis recovery trajectory of 2009 is a unique macroeconomic regime: the NASDAQ rose roughly 44% over the year while market microstructure was simultaneously evolving, making it unclear whether this relationship would replicate in a different year or market regime. High-frequency trading (HFT) dynamics likely inflate trade counts disproportionately during volatile, low-price periods, creating an asymmetric measurement artifact. Additionally, the X-axis label discrepancy (dataset labels appear swapped between axes based on the descriptions) warrants verification of the data alignment before drawing firm conclusions. Finally, R² of 59.1%, while substantial, leaves 40.9% of trade count variance unexplained by index level alone, pointing to omitted variables such as volatility (VIX), options expiration calendars, macroeconomic announcements, or sector-specific events.
Actionable Insights and Further Investigation
Practitioners and researchers should pursue several follow-up analyses. First, incorporating the VIX or realized volatility as a third variable would likely explain much of the residual variance and clarify whether the NASDAQ-trade count relationship is mediated primarily through volatility — a more parsimonious causal mechanism. Second, testing this relationship across multiple years (2007–2008 crisis, 2010–2019 expansion, 2020 COVID shock) would assess whether 2009 represents a stable structural relationship or a crisis-specific anomaly. Third, given the near-significant Granger causality (p = 0.067 for X→Y), expanding the lag search or using alternative causality frameworks (e.g., transfer entropy or VAR models) could reveal subtle predictive dynamics. Fourth, fitting a logarithmic or piecewise regression to the data would better capture the apparent non-linearity at the extremes. For trading strategy purposes, the absence of confirmed Granger causality means this correlation should not be used as a lagged trading signal without further validation, but the contemporaneous relationship could inform intraday liquidity and execution cost models.
X dataset: Cboe U.S. Equities Historical Market Volume Data 2009
Y dataset: NASDAQ Composite Index Daily (FRED)
Part of experiment: Daily - Cboe U.S. Equities Historical Market Volume Data 2009 vs NASDAQ Composite Index Daily (FRED)