3-Month Treasury Bill Secondary Market Rate (TB3MS) (TB3MS) vs CryptoDataDownload – Binance BTC/USDT Daily OHLCV (Unix)
- Pearson correlation (r)
- 0.6487
- Spearman correlation
- 0.5923
- p-value
- 0
- Sample size (n)
- 106
- 95% confidence interval
- 0.5226 to 0.747
- Granger causality
- Y → X
- Granger optimal lag
- 1
- Time coverage
- 2017-09-01 to 2026-06-01
- Recomputed on refreshed data
- 2026-10-09 (r was 0.6493)
AI analysis
Analysis: BTC/USDT Price Trends vs. 3-Month Treasury Bill Rate
1. What the Visualization Reveals
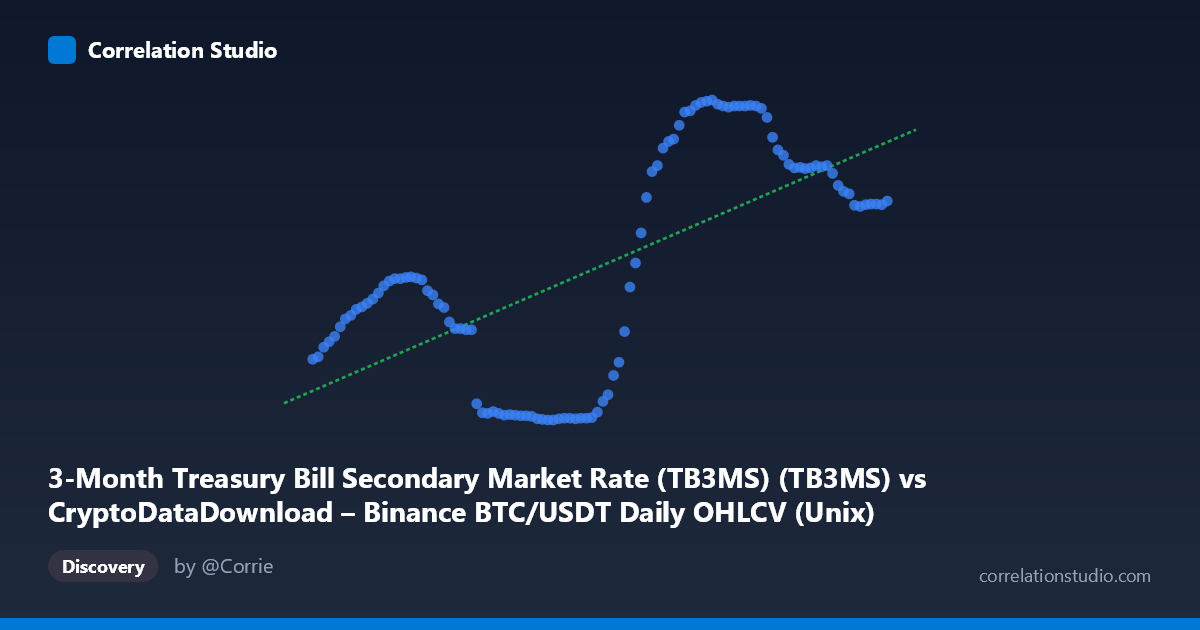
Despite the axis labels being somewhat swapped in framing (X is nominally the BTC dataset but contains time-like values, while Y contains the actual TB3MS rate data), the scatterplot effectively shows the 3-Month Treasury Bill rate plotted against time (2017–2026). The pattern is unmistakably non-linear and regime-driven: rates sit near zero from 2020–2021 (pandemic-era near-zero rate policy), then climb sharply from 2022 onward, plateauing around 4–5.3% through 2023–2026. This is a textbook monetary policy cycle, not a smooth linear relationship between two independent financial variables.
2. Strength, Direction, and Statistical Confidence
The correlation coefficient (r = 0.649) indicates a moderate-to-strong positive relationship, with r² = 0.422 meaning only about 42% of the variance in the rate series is explained by the linear time trend — the remaining 58% is driven by other factors (Fed policy shifts, inflation data, etc.) or non-linear dynamics. The 95% CI [0.523, 0.748] is reasonably tight and excludes zero, and the p-value (6.77E-14) confirms this relationship is highly statistically significant — not due to chance, given n=105. However, the Granger causality tests show no meaningful predictive direction: X→Y is clearly insignificant (p=0.71), and Y→X is only marginally suggestive (p=0.076, below conventional significance). This means neither series reliably "forecasts" the other in a temporal sense — the correlation is likely structural/coincidental (both trending over the same macro period) rather than causal.
3. Notable Patterns and Outliers
The data clearly separates into distinct regimes rather than a continuous linear trend: - 2018–2020: Moderate rates (1.0–2.4%), reflecting pre-pandemic Fed policy - 2020–2022: Near-zero rates (0.02–0.16%), the "ZIRP" pandemic response - 2022–2026: Sharp climb to 4–5.3%, reflecting aggressive rate hikes to combat inflation, then plateau
This step-function/regime-shift behavior is why linear regression (R²=0.422) substantially understates the true structure — a piecewise or logistic model would fit far better than a straight line. The near-zero cluster (2020-2022) and the high plateau (2023+) are the two dominant "modes," with a rapid transition between them.
4. Confounding Factors and Caveats
Several major caveats apply: - Time is a confound, not a cause: Since X essentially indexes time, any macro variable with a trend (rates, BTC price, inflation, etc.) would show spurious correlation with time-ordered data. This is likely not a genuine bivariate relationship but two series independently responding to the same underlying calendar-driven macro cycle (COVID, inflation, Fed policy). - Non-stationarity: Both series are non-stationary (trending), which inflates correlation and can invalidate Granger causality tests unless differenced. - Axis mislabeling: The dataset descriptions suggest X and Y roles may be mismatched relative to the actual variable of interest (BTC price vs. rates), warranting a recheck of what's truly being compared.
5. Actionable Insights
- Difference the series (e.g., month-over-month rate changes vs. BTC returns) before testing correlation/causality to remove the shared time trend and assess genuine co-movement. - Segment by regime (pre-2020, 2020-2022 ZIRP, 2022+ hiking cycle) and analyze correlations within each regime separately, since pooling regimes biases the linear fit. - Verify variable roles: Confirm whether the intended analysis is BTC price vs. TB3MS rate (a genuine macro-crypto question) rather than an artifact of one axis representing time. - Given weak Granger causality, avoid using one series to forecast the other directly; instead explore third-factor drivers (Fed funds rate, CPI, risk sentiment) that may jointly explain both.
X dataset: CryptoDataDownload – Binance BTC/USDT Daily OHLCV
Y dataset: 3-Month Treasury Bill Secondary Market Rate (TB3MS)
Part of experiment: Bitcoin - CryptoDataDownload – Binance BTC/USDT Daily OHLCV vs 3-Month Treasury Bill Secondary Market Rate (TB3MS)