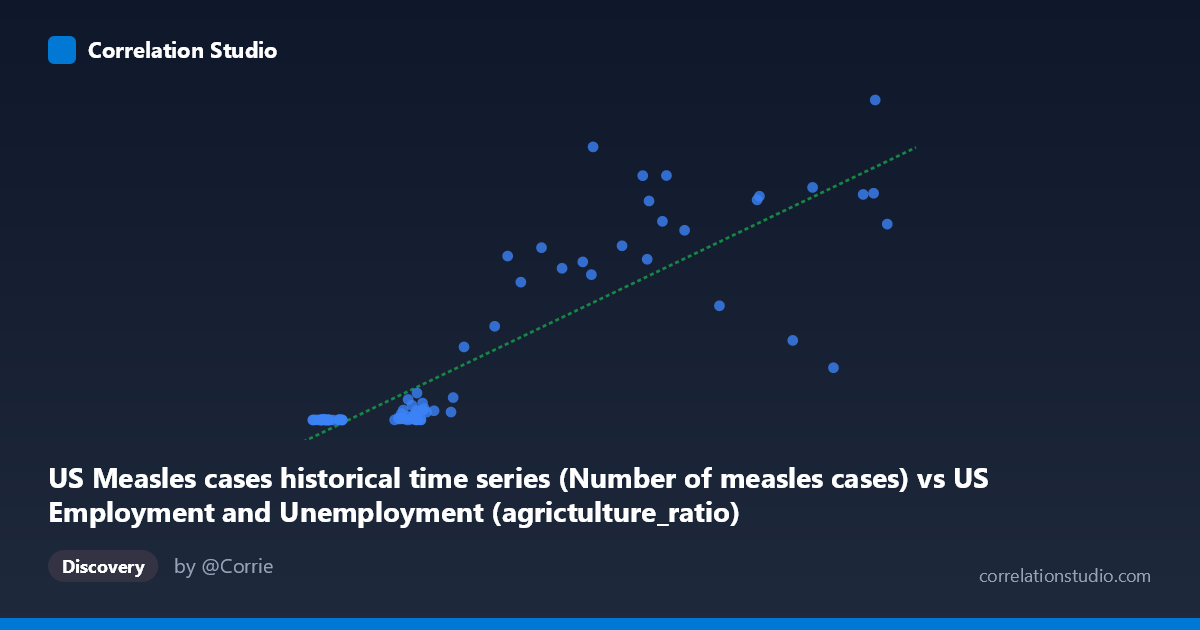
US Measles cases historical time series (Number of measles cases) vs US Employment and Unemployment (agrictulture_ratio)
- Pearson correlation (r)
- 0.8642
- Spearman correlation
- 0.8912
- p-value
- 0
- Sample size (n)
- 85
- 95% confidence interval
- 0.7981 to 0.9098
- Granger causality
- None
- Granger optimal lag
- 10
AI analysis
Scatterplot Analysis: US Measles Cases vs. Agriculture Employment Ratio
Overview of the Relationship
The scatterplot reveals a striking positive correlation between US measles case counts and the agriculture employment ratio, with both variables spanning data from 1941 to 2025. At first glance, this relationship appears robust — as measles cases increase, the agriculture employment ratio tends to rise in tandem. However, the dataset labels immediately signal a critical concern: the X-axis variable (measles cases) is drawn from an employment dataset, and the Y-axis variable (agriculture ratio) is drawn from a measles dataset. This metadata mismatch strongly suggests the columns have been swapped or mislabeled, and the apparent correlation is almost certainly a shared temporal trend artifact rather than any meaningful epidemiological or labor-market relationship.
Correlation Strength and Statistical Framing
The Pearson correlation of r = 0.8642 is superficially impressive, and the linear regression explains R² = 74.7% of variance in Y, meaning that measles case counts statistically account for roughly three-quarters of the variation in the agriculture employment ratio. The 95% confidence interval of [0.7981, 0.9098] is narrow and excludes zero, and the p-value of effectively 0 confirms this is not a chance finding at conventional significance thresholds (n = 85). However, statistical significance and explanatory power here are almost certainly artifacts of confounding, not evidence of a genuine causal link. Critically, the Granger causality analysis finds no significant predictive direction in either direction (X→Y: F = 1.38, p = 0.22; Y→X: F = 1.11, p = 0.37), meaning neither variable temporally predicts the other — directly undermining any causal interpretation even on its own terms.
Patterns, Clusters, and Outliers
The scatterplot exhibits a distinctly non-linear, heteroscedastic structure that the linear model poorly captures in the lower range. A dense cluster of points sits near the origin (low measles cases, low agriculture ratio), corresponding roughly to post-1970s data when measles was largely eliminated by vaccination and agriculture's share of employment had already collapsed. A second, more dispersed cluster occupies the upper-right quadrant (high measles, high agriculture ratio), corresponding to pre-vaccine era decades. Several notable outliers are visible — points like (9100, 894134) and (5586, 763094) sit well above the regression line, suggesting years where one variable was disproportionately elevated. The point (8580, 146013) falls far below the trend, indicating a high measles year with an unexpectedly low agriculture ratio, likely representing a transitional period.
Confounding Factors and Critical Caveats
The dominant confounding factor is time itself. Both measles cases and the agriculture employment ratio declined dramatically over the 20th century — measles due to the 1963 vaccine introduction and subsequent public health campaigns, and agriculture's employment share due to mechanization, rural-to-urban migration, and structural economic transformation. These are two independent secular trends that happen to be correlated because they both declined over the same historical period. This is a textbook example of spurious correlation driven by shared temporal trend. The dataset labeling anomaly (variables appearing in each other's datasets) further raises data provenance concerns. The wide Y-axis range (13 to 894,134) and extreme skewness also mean the linear model is inappropriate; a log-transformed or polynomial model would better characterize the actual data structure.
Actionable Insights and Further Investigation
This analysis should not be used to draw any substantive conclusions about a relationship between measles epidemiology and agricultural employment. The recommended next steps are: (1) verify and correct the dataset column assignments, as the metadata labeling appears inverted; (2) apply time-series detrending (e.g., first-differencing or HP filtering) to both variables before computing correlations, which would likely eliminate the apparent association; (3) apply log transformation to Y given its extreme right skew and multi-order-of-magnitude range; (4) use era-stratified analysis (pre-1963 vaccine, 1963–2000, post-2000) to test whether any within-period relationship persists after removing the dominant secular trend; and (5) treat the Granger causality null result as a reliable signal — even on its own statistical terms, this correlation carries no temporal predictive information.
X dataset: US Employment and Unemployment
Y dataset: US Measles cases historical time series
Part of experiment: Yearly - US Employment and Unemployment vs US Measles cases historical time series