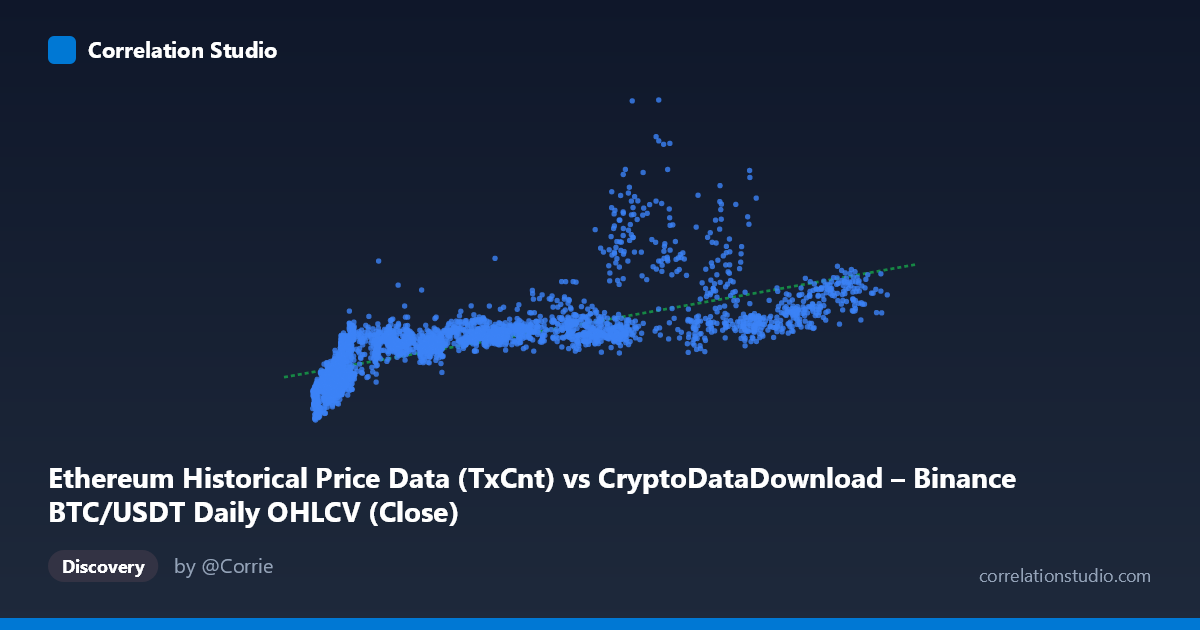
Ethereum Historical Price Data (TxCnt) vs CryptoDataDownload – Binance BTC/USDT Daily OHLCV (Close)
- Pearson correlation (r)
- 0.7288
- Spearman correlation
- 0.8809
- p-value
- 0
- Sample size (n)
- 3191
- 95% confidence interval
- 0.7121 to 0.7446
- Granger causality
- None
- Granger optimal lag
- 10
AI analysis
Analysis: Ethereum Transaction Count vs. BTC/USDT Closing Price
1. Relationship Overview
Despite the confusing axis labels (which appear to be swapped or mislabeled in the metadata — the X-axis is described as Ethereum transaction count while Y is described as BTC closing price, but the dataset descriptions suggest both series may actually be tracking BTC/USDT price behavior over time), the scatterplot shows a moderate-to-strong positive relationship. As X increases, Y tends to increase as well, though with considerable scatter rather than a tight linear band. The sample points show X ranging from ~3,800 to ~110,000 paired with Y values from ~260,000 to ~2,900,000, with the relationship appearing curved rather than strictly linear — low X values cluster with lower Y values, but the rate of Y increase appears to accelerate and then show high variance at mid-to-high X values.
2. Strength, Direction, and Statistical Confidence
The Pearson correlation of r = 0.729 indicates a moderately strong positive linear relationship, with r² = 0.531 meaning the linear model explains only about 53% of the variance in Y — leaving nearly half unexplained by X alone. The 95% CI [0.712, 0.745] is tight (reflecting the large sample, n=3,191), and the p-value of ~0 confirms this correlation is highly statistically significant and not due to chance. However, statistical significance ≠ practical predictive power: with only half the variance explained, X alone is an incomplete predictor of Y.
Critically, the Granger causality tests show no significant predictive direction in either direction (X→Y: p=0.43; Y→X: p=0.66). This means that despite the contemporaneous correlation, neither variable reliably helps forecast the other's future values based on past values — even at an optimal lag of 10 periods. This strongly suggests the correlation is driven by a shared external trend or common underlying factor (e.g., both series responding to overall crypto market cycles, adoption growth, or time itself) rather than one variable causing or leading the other.
3. Notable Patterns and Non-linearity
Several features stand out: - Heteroscedasticity: variance in Y increases substantially as X grows — at X≈65,000-90,000, Y ranges widely from ~1.2M to ~2.9M, suggesting the relationship isn't uniform across the range. - Low-end clustering: many points sit at small X (3,000–15,000) with Y values also compressed at the lower end (~300K–1.1M), forming a denser cluster. - Possible curvature: the note that Spearman ρ exceeds Pearson r is a strong signal of monotonic but non-linear behavior — likely logarithmic or power-law, common in financial/crypto data where growth compounds. - Outliers: points like (66,901.99, 2,428,667) and (64,656.02, 2,027,183) sit well above the regression line, suggesting periods of decoupling — possibly market-specific rallies or shocks affecting Y disproportionately.
4. Confounding Factors and Caveats
The overlapping time coverage (2017–2026) spans multiple crypto market cycles (bull runs, crashes, halving events), meaning both series are likely non-stationary and trending together over time — a classic setup for spurious correlation in time-series data. Shared macro drivers (overall crypto adoption, Bitcoin dominance effects on Ethereum-related metrics, exchange volume trends, or even both being denominated in USDT and subject to the same market sentiment) could inflate the correlation without genuine causal linkage. The metadata inconsistency (X described as "Ethereum TxCnt" but sourced from a BTC dataset) also raises concerns about data pipeline errors or mislabeling that should be resolved before drawing further conclusions.
5. Recommendations
- Verify data labeling: Confirm which variable is truly ETH transaction count vs. BTC price before proceeding — the current labels are contradictory. - Test for non-linear fits: Given Spearman Pearson, fit log-log or polynomial regression models to check if r² improves substantially. - De-trend and re-test: Apply differencing or detrending (e.g., using log returns instead of levels) to control for shared time trends, then re-run correlation and Granger tests — this will reveal whether the relationship holds beyond mutual drift. - Segment by market regime: Break data into bull/bear/sideways periods to see if the r² and slope are stable or regime-dependent, given the high-X heteroscedasticity observed. - Avoid causal claims: Given the null Granger result, do not use one series to forecast the other in a trading or predictive model without further validation.
X dataset: CryptoDataDownload – Binance BTC/USDT Daily OHLCV
Y dataset: Ethereum Historical Price Data
Part of experiment: Bitcoin - CryptoDataDownload – Binance BTC/USDT Daily OHLCV vs Ethereum Historical Price Data