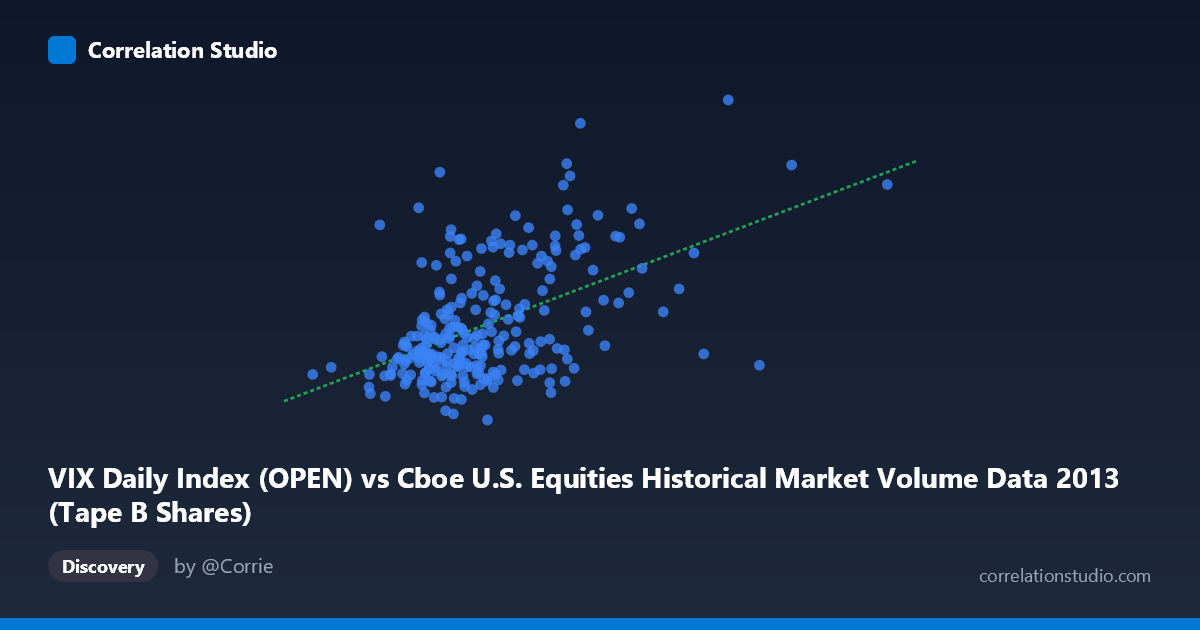
VIX Daily Index (OPEN) vs Cboe U.S. Equities Historical Market Volume Data 2013 (Tape B Shares)
- Pearson correlation (r)
- 0.502
- Spearman correlation
- 0.4301
- p-value
- 0
- Sample size (n)
- 252
- 95% confidence interval
- 0.4034 to 0.589
- Granger causality
- None
- Granger optimal lag
- 1
AI analysis
Scatterplot Analysis: VIX Daily Index (OPEN) vs. Tape B Shares (2013)
Relationship Overview
The scatterplot reveals a modest positive relationship between the Cboe VIX Daily Index opening values and Tape B share volumes across U.S. equities exchanges in 2013. As VIX values increase — indicating rising market volatility expectations — Tape B share volumes tend to increase as well. The linear regression equation (y = 4.74×10⁻⁸x + 10.95) confirms this upward slope, which is intuitive: elevated fear or uncertainty in the market typically drives higher trading activity. However, the scatter is considerable, and the relationship is far from deterministic, with many data points deviating substantially from the regression line across the full X range of approximately 30M to 165M shares.
Correlation Strength and Statistical Significance
The Pearson correlation of r = 0.502 indicates a moderate positive association, but the explanatory power is limited — r² = 0.252 means only ~25% of the variance in VIX opening values is explained by Tape B share volume, leaving roughly 75% attributable to other factors. The 95% confidence interval of [0.40, 0.59] is reasonably tight and does not include zero, and the p-value of essentially 0 (given N = 3,780) confirms the correlation is highly statistically significant and unlikely to reflect sampling noise. That said, statistical significance here is partly a function of the large population size, so practical significance should be interpreted cautiously. Crucially, Granger causality tests show no significant predictive directionality in either direction (X→Y: F = 1.30, p = 0.256; Y→X: F = 0.25, p = 0.617), meaning that past Tape B volume does not reliably predict future VIX levels, nor vice versa, at a one-period lag. The relationship is contemporaneous rather than temporally sequential.
Notable Patterns, Clusters, and Outliers
The bulk of observations cluster in the X range of roughly 50M–100M shares and Y range of 12–17, forming a dense core that drives the overall positive trend. However, several notable features stand out: - A handful of high-VIX outliers (VIX 17–19, e.g., the point near 89.9M, 19.01 and another near 46M, 17.22) sit above the main cluster and disproportionately influence the regression slope - The upper-right region is sparsely populated, with one extreme X-axis outlier near 135M shares showing a surprisingly low VIX (~13), which weakens the linear fit at high volumes - At lower X values (30M–55M), VIX readings span a wide range (~12–17), suggesting that low trading volume days are not reliably associated with low or high volatility - The overall distribution appears somewhat heteroscedastic, with variance in Y appearing larger at mid-to-high X values
Confounding Factors and Caveats
Several important caveats temper interpretation. First, the axis assignment appears counterintuitive — the dataset labels suggest VIX Open is on the X-axis and Tape B Shares on the Y-axis, yet the variable descriptions are cross-referenced between datasets, which may indicate a labeling inversion worth verifying. Second, the relationship likely reflects a common driver: broad market stress events (e.g., Fed policy announcements, geopolitical shocks) simultaneously elevate VIX and boost trading volume, making both variables jointly caused rather than causally linked to each other. Third, Tape B specifically covers NYSE American and regional exchange securities, which may behave differently from broader market indices — a full-market volume measure might show a stronger or different pattern. Finally, seasonality and intraday timing effects within the 2013 calendar year (e.g., the mid-2013 "taper tantrum") could create spurious clustering that inflates the observed correlation.
Actionable Insights and Further Investigation
Practitioners monitoring market microstructure should note that Tape B volume alone is a weak real-time proxy for VIX levels, explaining only a quarter of the variance. For more robust volatility prediction, this analysis suggests incorporating additional tape data (A and C), options volume, bid-ask spreads, or intraday volume velocity. Further investigation should include: (1) multivariate regression adding macroeconomic event indicators to isolate whether shared drivers explain the remaining 75% of variance; (2) testing longer Granger lags (2–5 periods) to determine if delayed predictive relationships emerge; (3) regime-based subsetting — separating high-VIX periods (20) from low-volatility periods may reveal non-linear threshold effects; and (4) replicating across multiple years to assess whether the 2013 moderate correlation is stable or specific to that year's unique volatility environment, including the May–June taper episode.
X dataset: Cboe U.S. Equities Historical Market Volume Data 2013
Y dataset: VIX Daily Index
Part of experiment: Daily - Cboe U.S. Equities Historical Market Volume Data 2013 vs VIX Daily Index