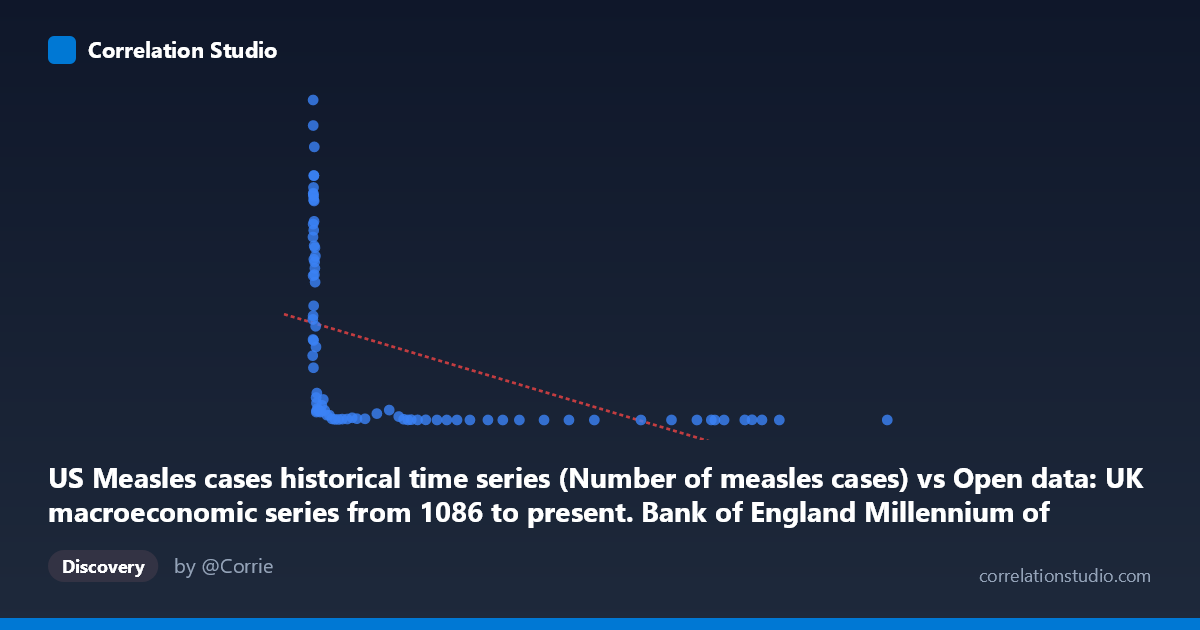
US Measles cases historical time series (Number of measles cases) vs Open data: UK macroeconomic series from 1086 to present. Bank of England Millennium of Macroeconomic Data. (Month) (value)
- Pearson correlation (r)
- -0.4693
- Spearman correlation
- -0.9101
- p-value
- 0.000007
- Sample size (n)
- 84
- 95% confidence interval
- -0.6212 to -0.2834
- Granger causality
- None
- Granger optimal lag
- 10
AI analysis
Analysis: US Measles Cases vs. UK Macroeconomic Data
1. What the Visualization Reveals
The scatterplot displays a broadly inverse relationship between US measles case counts (X-axis) and a UK macroeconomic variable (Y-axis, likely nominal GDP or a related monetary series given the Bank of England dataset context) across the period 1919–2017. The visual pattern is striking: when measles cases are low (X < ~5,000), the macroeconomic values span an enormous range (roughly 37 to 894,134), while at high measles case counts (X ~20,000), the macroeconomic values collapse to very low numbers (nearly all below ~30,000). This creates a pronounced "hockey stick" or hyperbolic shape rather than a clean linear descent, immediately signaling that the true underlying relationship — to the extent any genuine one exists — is heavily non-linear and potentially dominated by temporal trends common to both series.
2. Correlation Strength, Direction, and Predictive Power
The Pearson correlation of r = -0.4693 indicates a moderate negative association, but the coefficient of determination r² = 0.2202 tells a more sobering story: only 22% of the variance in the UK macroeconomic series is statistically explained by US measles case counts. The remaining ~78% is unexplained by this linear model. The 95% confidence interval for r spans [-0.621, -0.283], which is entirely negative and does not cross zero, and the p-value of 6.7 × 10⁻⁶ confirms the correlation is statistically significant. However, statistical significance here is largely a function of the sample size (n = 84) and shared secular time trends — it does not imply practical or causal meaning. Critically, the Granger causality tests show no significant predictive directionality in either direction (X→Y: F = 0.875, p = 0.561; Y→X: F = 1.102, p = 0.378), meaning that knowing past measles case counts does not help predict future UK macroeconomic values, and vice versa. This is a decisive finding against any temporal causal interpretation.
3. Notable Patterns, Clusters, and Outliers
Several structural features stand out in the data:
- High-Y, Low-X cluster: A dense cluster of points with X < ~1,000 and Y ranging from ~150,000 to ~894,000 dominates the upper-left quadrant. These likely correspond to post-WWII and later decades when measles cases were declining (or low following vaccination) and UK nominal macroeconomic values were rising due to long-run growth and inflation. - High-X, Low-Y cluster: Points with X ~20,000 (large measles outbreaks, pre-vaccine era, roughly 1919–1960s) are tightly compressed near Y ≈ 37–500, reflecting low historical UK nominal values. - Extreme outliers: The point (164.44, 894,134) is the highest Y value by a wide margin. Points like (116,836, 120) and (91,374, 191) represent extreme X values with near-zero Y. These leverage points significantly influence the Pearson r. - Non-linearity: As flagged by the note that Spearman ρ exceeds Pearson r, a logarithmic or power-law model would fit substantially better than the fitted linear equation y = -4.109x + 272,018. A log-log or semi-log transformation of both axes would likely linearize the relationship and reveal a much cleaner (though still spurious) monotonic pattern.
4. Confounding Factors and Critical Caveats
This correlation is a near-textbook example of spurious correlation driven by parallel secular trends:
- Time as the hidden driver: Both series change monotonically over the 20th century for entirely independent reasons. US measles cases fell dramatically after the 1963 vaccine introduction; UK macroeconomic nominal values (GDP, money supply, prices) rose due to economic growth and inflation. Both trends are anchored to the same calendar, creating an artificial inverse correlation. - Cross-national dataset mismatch: The X variable is US epidemiological data; the Y variable is UK macroeconomic data. There is no plausible direct mechanism linking them. - Nominal vs. real values: If Y represents nominal GDP or money supply, inflationary growth alone over 100 years would produce a strong upward trend regardless of any other variable. - Non-linear scale compression: The enormous ranges in both variables (X spans three orders of magnitude; Y spans four) mean that linear regression is poorly suited, and the r² of 22% is inflated by the structure of the data rather than reflecting a true bivariate relationship. - Optimal lag of 10 periods: The Granger test's optimal lag of 10 years is unusually long and suggests the model is fitting noise rather than a genuine lagged mechanism.
5. Actionable Insights and Further Investigation
Given the clear absence of Granger causality and the obvious spurious nature of this correlation, the following steps are recommended:
1. Detrend both series before computing correlation — apply first-differencing or HP filtering to remove shared secular trends and test whether any residual correlation persists. The expectation is that it would largely vanish. 2. Log-transform both axes to assess the Spearman/non-linear relationship more rigorously; a log-log regression would better characterize the scale-spanning data. 3. Restrict the analysis to a theoretically motivated question: If the goal is to study disease burden and economic outcomes, pair US measles data with US economic data, or UK measles data with UK macroeconomic data, to at least ensure geographic coherence. 4. Apply cointegration testing (e.g., Engle-Granger) if a long-run relationship is hypothesized, as Granger causality alone may miss structural cointegration in century-long time series. 5. Treat this result as a cautionary example: The statistically significant p-value with a meaningless cross-national pairing underscores why domain knowledge and causal reasoning must accompany any automated correlation analysis, particularly with long historical time series.
X dataset: Open data: UK macroeconomic series from 1086 to present. Bank of England Millennium of Macroeconomic Data. (Month)
Y dataset: US Measles cases historical time series
Part of experiment: Yearly - Open data: UK macroeconomic series from 1086 to present. Bank of England Millennium of Macroeconomic Data. (Month) vs US Measles cases historical time series