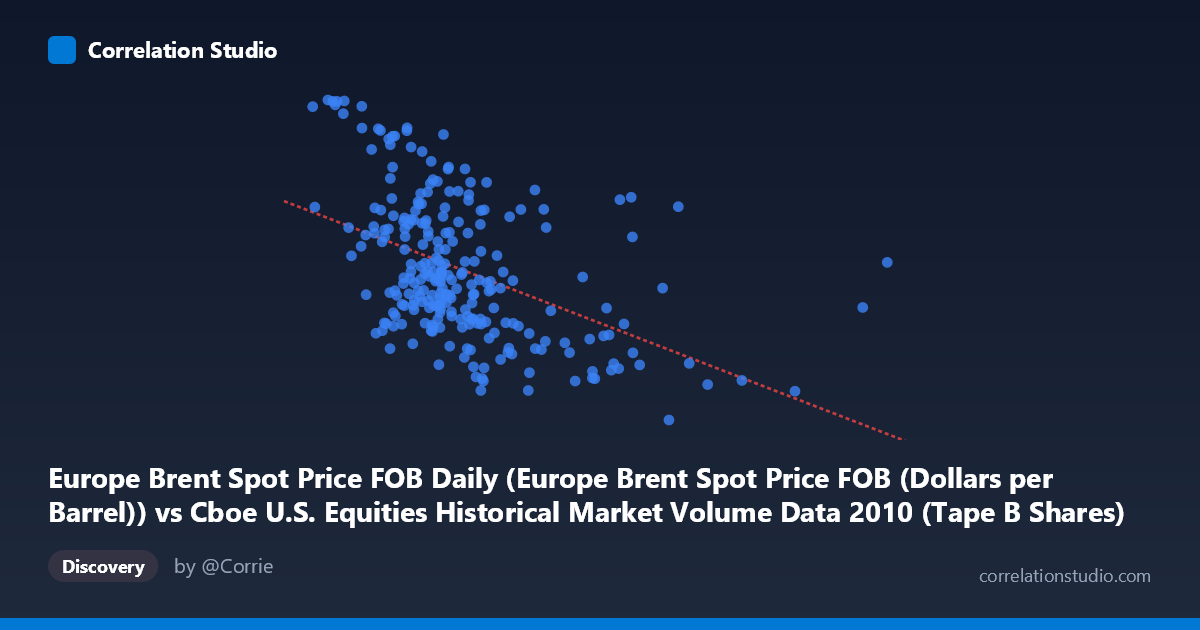
Europe Brent Spot Price FOB Daily (Europe Brent Spot Price FOB (Dollars per Barrel)) vs Cboe U.S. Equities Historical Market Volume Data 2010 (Tape B Shares)
- Pearson correlation (r)
- -0.4685
- Spearman correlation
- -0.4905
- p-value
- 0
- Sample size (n)
- 252
- 95% confidence interval
- -0.5597 to -0.3661
- Granger causality
- None
- Granger optimal lag
- 1
- Time coverage
- 2010-01-04 to 2010-12-31
- Recomputed on refreshed data
- 2026-10-21 (r was -0.4685)
AI analysis
Analysis: Europe Brent Spot Price vs. Cboe Tape B Shares (2010)
Relationship Overview The scatterplot reveals a moderate negative relationship between Europe Brent Spot Price FOB (X-axis) and Cboe Tape B share volume (Y-axis) across 252 trading days in 2010. As oil prices rise, Tape B equity share volume tends to decline, and vice versa. The linear regression equation (y = -6.30E-08x + 86.72) confirms this downward slope, though the scatter around the regression line is substantial, indicating that oil price alone is far from a complete explanation of equity trading volume behavior.
Correlation Strength and Statistical Significance The Pearson correlation of r = -0.4685 reflects a moderate negative association. Critically, the R² of 0.2195 means that only about 22% of the variance in Tape B share volume is explained by Brent crude prices — the remaining 78% is driven by other factors entirely. The 95% confidence interval of [-0.5597, -0.3661] is entirely negative and does not cross zero, reinforcing directional confidence, and the p-value of 3.775E-15 makes this correlation statistically highly significant given the sample of 252 paired observations drawn from a population of 3,302. However, statistical significance here is largely a function of sample size and should not be conflated with practical or economic significance. The Granger causality results are particularly telling: neither direction clears the conventional 0.05 threshold (X→Y: F=0.812, p=0.368; Y→X: F=3.578, p=0.060), meaning neither variable reliably predicts the other temporally at a 1-period lag. The Y→X direction approaches marginal significance, hinting that Tape B volume may have a weak leading tendency over oil prices, but this remains inconclusive.
Patterns, Clusters, and Outliers Several notable features emerge from the sample points. There is visible clustering in the moderate oil-price range (~$80–$120/barrel), where Tape B volume spans a wide range from roughly 72 to 91, suggesting high variability in that zone. At lower oil prices (roughly $45–$70/barrel), higher Tape B volumes appear more consistently — points like (45,218,507, 93.63) and (53,515,550, 93.55) stand out as high-volume, low-price observations that align with the negative trend but represent potential outliers at the extremes. At higher oil prices ($180M range in X units), volume tends to cluster in the lower 67–77 range, with (218,020,583, 67.18) being a notable low-volume extreme. The relationship does not appear strongly non-linear from the sample, though the wide dispersion at mid-range X values suggests possible heteroscedasticity or regime-dependent behavior.
Confounding Factors and Caveats Several important caveats apply. First, this is a spurious or indirect correlation — Brent crude prices and Tape B equity volumes are both influenced by macroeconomic conditions (risk sentiment, economic growth expectations, Federal Reserve policy in 2010 post-financial crisis), making it difficult to isolate a causal mechanism. Second, Tape B specifically covers NYSE American and regional exchange stocks, which may have sector-specific sensitivities not representative of the broader market. Third, 2010 was an unusual year marked by the European sovereign debt crisis and the Flash Crash (May 6, 2010), which could create episodic volume spikes or price dislocations that inflate or distort the apparent correlation. Finally, the Granger causality failure at lag-1 strongly cautions against assuming any predictive utility from this relationship in practice.
Actionable Insights and Further Investigation Practitioners should not use Brent crude prices as a standalone predictor of Tape B trading volume given the weak explanatory power and absence of Granger causality. However, the moderate correlation warrants deeper investigation. Recommended next steps include: (1) testing multiple lags in Granger causality beyond lag-1 to detect slower-moving relationships; (2) segmenting the data by market regime (pre/post Flash Crash, high vs. low VIX periods) to assess whether the correlation strengthens under specific conditions; (3) introducing control variables such as VIX, S&P 500 returns, or USD strength to partial out macroeconomic confounders; and (4) examining whether energy-sector stocks within Tape B specifically drive this relationship, which would provide a more economically coherent mechanism for the observed negative correlation.
X dataset: Cboe U.S. Equities Historical Market Volume Data 2010
Y dataset: Europe Brent Spot Price FOB Daily
Part of experiment: Daily - Cboe U.S. Equities Historical Market Volume Data 2010 vs Europe Brent Spot Price FOB Daily