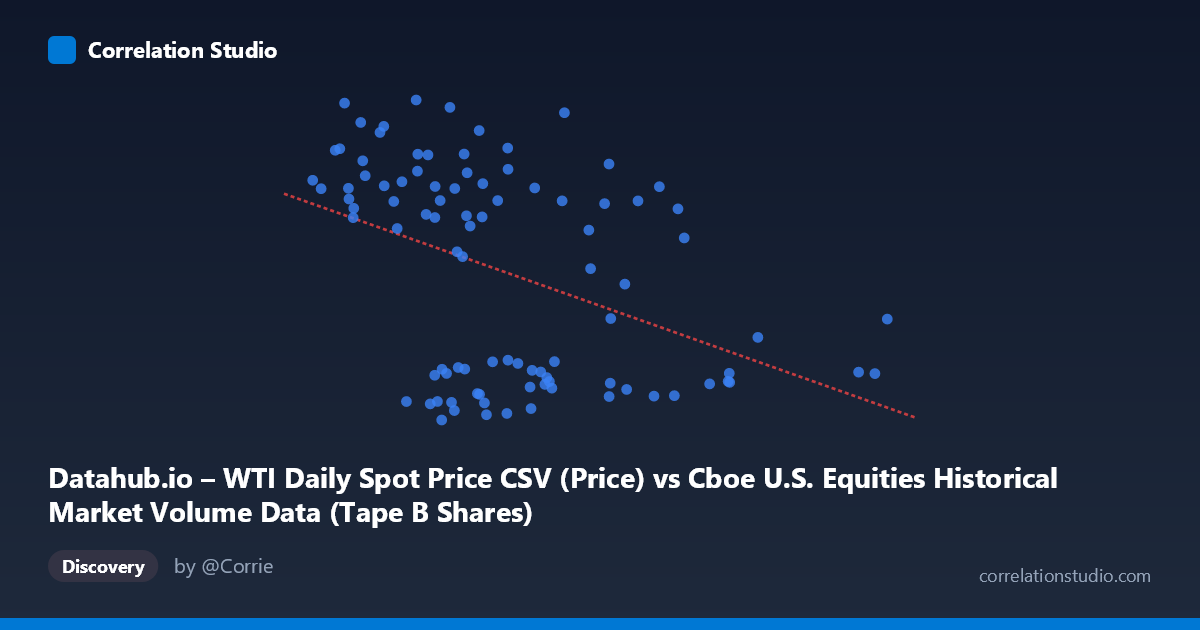
Datahub.io – WTI Daily Spot Price CSV (Price) vs Cboe U.S. Equities Historical Market Volume Data (Tape B Shares)
- Pearson correlation (r)
- -0.4228
- Spearman correlation
- -0.4234
- p-value
- 0.000022
- Sample size (n)
- 94
- 95% confidence interval
- -0.5761 to -0.2408
- Granger causality
- None
- Granger optimal lag
- 1
AI analysis
Scatterplot Analysis: WTI Crude Oil Price vs. Cboe Tape B Share Volume
Relationship Overview The scatterplot reveals a modest negative relationship between WTI crude oil daily spot prices (X-axis) and Cboe Tape B share volume (Y-axis) over the period from January to May 2026. The linear regression equation (y = -1.45377E-07x + 115.451) indicates that as WTI prices increase, Tape B equity trading volume tends to decrease. Visually, the data points form a loosely dispersed cloud with a downward-sloping trend, suggesting the relationship is real but far from deterministic. The spread is considerable, with many data points deviating substantially from the regression line, reinforcing that this is a weak-to-moderate association rather than a tight predictive relationship.
Correlation Strength and Statistical Significance The Pearson correlation of r = -0.4228 indicates a moderate negative association, but the more critical metric is r² = 0.1788, meaning WTI price explains only about 17.9% of the variance in Tape B share volume — leaving over 82% attributable to other factors. The 95% confidence interval for r spans [-0.5761, -0.2408], which is meaningfully wide, reflecting genuine uncertainty about the true population correlation despite the statistically significant p-value of 2.181E-05. That p-value confirms the correlation is unlikely due to chance given the sample size (n = 94), but statistical significance should not be conflated with practical importance given the modest r². Critically, Granger causality tests find no significant directional predictive relationship in either direction (X→Y: F = 0.0021, p = 0.9640; Y→X: F = 0.0325, p = 0.8574), meaning that past WTI prices do not help forecast future Tape B volume, and vice versa. This is a crucial caveat: the correlation is contemporaneous rather than temporally predictive.
Notable Patterns, Clusters, and Outliers Several structural features stand out. There appears to be a bimodal vertical clustering: a group of points concentrated in the Y range of ~56–70 (lower volume) spread across a wide X range, and a second cluster at Y values of ~90–115 (higher volume) more concentrated toward lower X values (roughly 136M–210M price range). This bifurcation hints at a possible regime-like behavior — two distinct market states — rather than a smooth linear relationship. Notable outliers include the point near (393M, 74.48) and (388M, 64.50), which represent the highest WTI prices in the dataset and sit at relatively low Tape B volumes, broadly consistent with the negative trend. Conversely, (182.97M, 114.58) and (150.99M, 114.01) represent the highest Tape B volume readings paired with relatively low WTI prices. A linear model may be oversimplifying what could be a step-function or threshold relationship.
Confounding Factors and Caveats Several important caveats apply. First, the dataset and axis labels appear inverted in the metadata description — WTI price is listed as coming from the Cboe dataset column, and Tape B volume from the WTI dataset — suggesting a possible data labeling or joining artifact that warrants verification before drawing firm conclusions. Second, the time window (January–May 2026) is narrow (~4.5 months), limiting generalizability; short-window correlations between oil prices and equity volume can be driven by idiosyncratic macro events (e.g., geopolitical shocks, OPEC decisions, risk-off episodes) that may not persist. Third, Tape B volume specifically covers NYSE American and regional exchange stocks, which may respond differently to oil prices than broader market volume. Finally, omitted variables such as VIX (volatility index), Federal Reserve policy signals, broader equity index movements, or sector rotation dynamics likely explain much of the residual variance.
Actionable Insights and Further Investigation Given the weak explanatory power and absence of Granger causality, WTI price alone is not a reliable standalone predictor of Tape B share volume and should not be used in isolation for trading or market-making strategies. However, the moderate correlation and apparent clustering suggest value in segmenting the analysis by market regime — for instance, separating high-volatility from low-volatility periods using VIX as a conditioning variable. Further investigation should include: (1) extending the time series beyond 2026 to test whether the negative relationship persists across different oil price cycles; (2) testing non-linear models (e.g., piecewise regression or quantile regression) to better capture the apparent bimodal structure; (3) multivariate analysis incorporating broader equity market conditions, sector ETF flows, and macroeconomic releases; and (4) resolving the metadata labeling discrepancy to ensure the axes represent what they purport to measure before any production use of this analysis.
X dataset: Cboe U.S. Equities Historical Market Volume Data
Y dataset: Datahub.io – WTI Daily Spot Price CSV
Part of experiment: Daily - Cboe U.S. Equities Historical Market Volume Data vs Datahub.io – WTI Daily Spot Price CSV