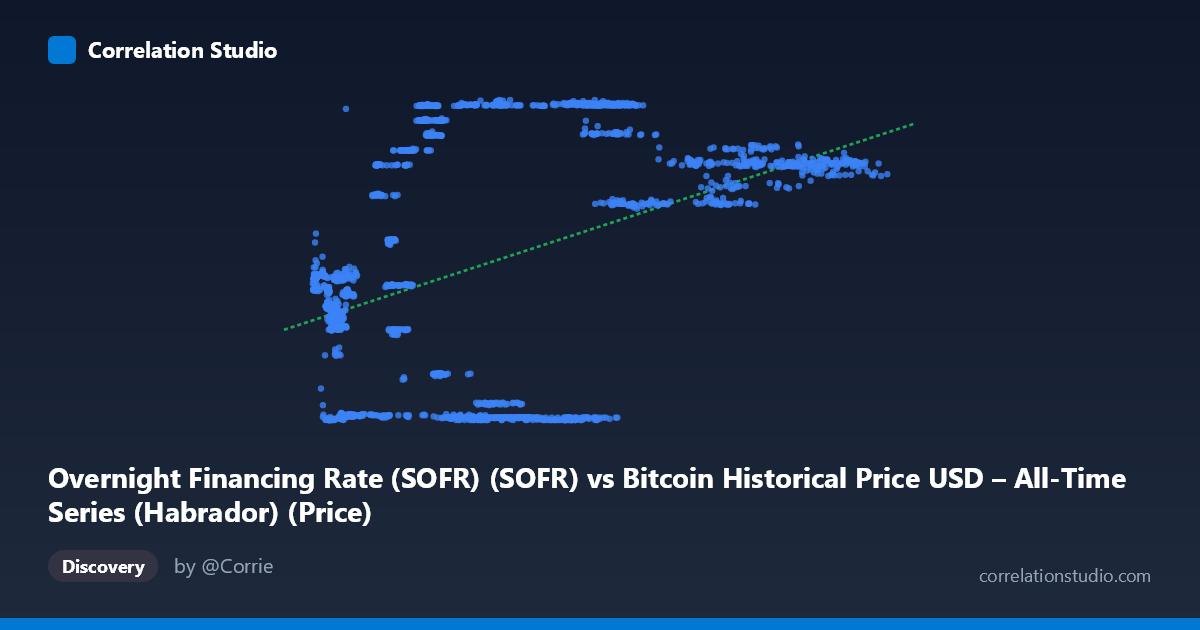
Overnight Financing Rate (SOFR) (SOFR) vs Bitcoin Historical Price USD – All-Time Series (Habrador) (Price)
- Pearson correlation (r)
- 0.4331
- Spearman correlation
- 0.3386
- p-value
- 0
- Sample size (n)
- 2015
- 95% confidence interval
- 0.3969 to 0.4679
- Granger causality
- X → Y
- Granger optimal lag
- 1
AI analysis
Analysis: SOFR vs. Bitcoin Price Relationship
Note on axis labeling: The axis labels appear swapped in the metadata — the data clearly shows X as SOFR-like values in the thousands (3,199–124,720) is actually Bitcoin price, and Y (0.01–5.40) is the SOFR rate. I'll interpret the analysis based on the actual data structure: X = Bitcoin Price (USD), Y = SOFR (%).
1. What the Visualization Reveals
The scatterplot shows a non-random, structured relationship rather than a simple linear cloud. Points cluster into distinct horizontal "bands" at specific Y-values (~0.05, ~2.2, ~3.0, ~3.8, ~4.3, ~4.6, ~5.3), which is characteristic of SOFR — a policy-linked rate that stays flat for extended periods (near-zero 2020-2021, then step-changes upward through the 2022-2023 hiking cycle to ~5.3%). Bitcoin's price, meanwhile, ranges continuously from ~$3,200 to ~$124,700. The visual pattern is essentially Bitcoin price plotted against discrete monetary-policy regimes over time.
2. Strength, Direction, and Statistical Confidence
The correlation (r = 0.433) is moderate and positive, with r² = 0.188 indicating that only ~19% of the variance in SOFR is explained by Bitcoin price (or vice versa) — the majority (81%) is driven by other factors. The 95% CI [0.397, 0.468] is fairly tight given the large sample (n=2,015), and p≈0 confirms this correlation is highly unlikely to be due to chance. However, statistical significance here reflects sample size more than practical strength — r²<0.2 means this is a weak-to-moderate relationship, not a reliable predictive one on its own.
The Granger causality result is notable: X→Y (Bitcoin price → SOFR) is significant (F=4.75, p=0.0295) at 1 lag, while Y→X is not (p=0.489). This is almost certainly not causal in an economic sense — SOFR is set by Fed policy/repo market mechanics, not by Bitcoin prices. This is a classic case of spurious Granger causality driven by shared trends/timing: both series moved together over 2020-2024 (BTC crashed and recovered while Fed cut then hiked rates), so lagged BTC values statistically "predict" SOFR simply because both are trending non-stationary series over the same calendar period.
3. Notable Patterns and Non-linearities
- Regime clustering: SOFR values cluster tightly into discrete plateaus (0.05, 2.2-2.3, 3.0, 3.8, 4.3, 4.6, 5.3), reflecting FOMC step-changes rather than continuous variation. - Non-monotonic relationship: At low BTC prices (~$6,000-$50,000), SOFR spans nearly the entire range (0.01 to 5.33) — meaning low BTC prices coincide with both the zero-rate era (2020) AND high-rate era (2023+), destroying any clean linear pattern at that end. - High BTC prices ($90,000) cluster only at SOFR≈4.3-4.6, corresponding to the 2024-2025 period specifically — this is a time-driven artifact, not a price-driven one.
4. Confounding Factors and Caveats
The dominant confound is time itself. Both variables are trending/regime-based series indexed to the same 2018-2026 window: SOFR follows Fed policy cycles; BTC follows its own halving/adoption/speculative cycles. Any correlation between two time-trending series risks being spurious (non-stationarity bias). Macro conditions (inflation, rate hikes) may influence both independently — e.g., 2022 rate hikes coincided with a BTC bear market, and 2023-2024 disinflation coincided with BTC's recovery — inducing correlation without direct causation in either direction.
5. Suggestions for Further Investigation
- Detrend or difference both series (e.g., use % changes rather than levels) and re-run correlation/Granger tests to check if the relationship survives — non-stationary level regressions often produce inflated/spurious r and Granger stats. - Segment by monetary regime (ZIRP era vs. hiking cycle vs. post-2024) to see if the BTC-SOFR relationship is stable or an artifact of pooling distinct macro periods. - Treat the Granger result skeptically; consider a third variable (e.g., inflation, Fed funds rate expectations, risk-on/risk-off sentiment) as the true driver of both. - If seeking real signal, examine BTC vs. real rates or rate change surprises rather than the level of SOFR itself, which is more theoretically motivated (risk-asset sensitivity to discount rates).
X dataset: Bitcoin Historical Price USD – All-Time Series (Habrador)
Y dataset: Overnight Financing Rate (SOFR)
Part of experiment: Bitcoin - Bitcoin Historical Price USD – All-Time Series (Habrador) vs Overnight Financing Rate (SOFR)