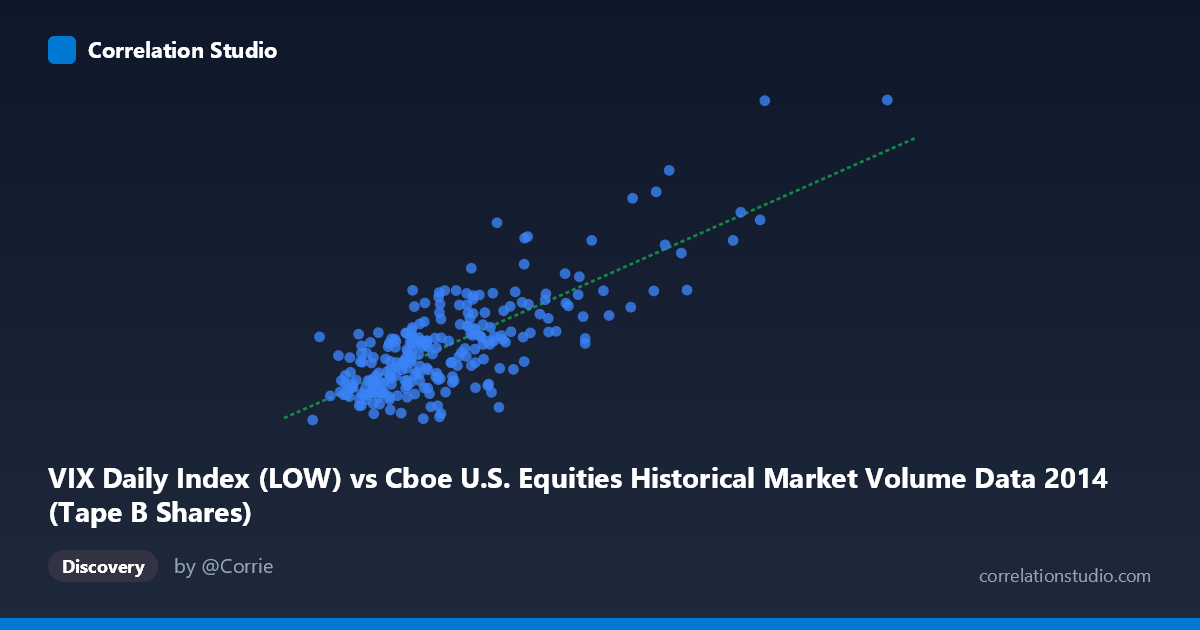
VIX Daily Index (LOW) vs Cboe U.S. Equities Historical Market Volume Data 2014 (Tape B Shares)
- Pearson correlation (r)
- 0.7792
- Spearman correlation
- 0.6684
- p-value
- 0
- Sample size (n)
- 252
- 95% confidence interval
- 0.7255 to 0.8235
- Granger causality
- None
- Granger optimal lag
- 1
AI analysis
Scatterplot Analysis: VIX Daily Index (LOW) vs. Tape B Shares (2014)
Relationship Overview The scatterplot reveals a positive relationship between the VIX Daily Index Low values and Tape B share volume across U.S. equities exchanges in 2014. As the VIX low increases — indicating elevated baseline volatility even at daily troughs — Tape B trading share volume tends to rise correspondingly. This makes intuitive sense: higher volatility environments typically drive increased trading activity across all tape categories as market participants reposition, hedge, or react to uncertainty. The linear regression equation (y = 7.25×10⁻⁸x + 8.154) confirms a positive slope, suggesting that for each unit increase in VIX low, Tape B shares increase meaningfully.
Correlation Strength and Statistical Framing The correlation is moderately strong (r = 0.7792), and the r² of 0.6072 indicates that approximately 60.7% of the variance in Tape B share volume is explained by VIX low values — a substantial but incomplete explanatory picture, with roughly 39% of variance attributable to other factors. The 95% confidence interval [0.7255, 0.8235] is relatively narrow and sits comfortably above zero, reinforcing confidence in the estimate's reliability. The p-value of essentially zero confirms the correlation is highly statistically significant across the 252 paired samples. However, the Granger causality results undercut any temporal predictive story: neither direction (X→Y nor Y→X) reaches significance (F = 0.81, p = 0.37 and F = 0.02, p = 0.89 respectively). This means that while the two series move together, neither variable reliably predicts the other in the next period — the relationship is contemporaneous rather than predictive.
Notable Patterns, Clusters, and Outliers The data exhibits a clear linear core concentrated in the lower-left region, where VIX low values cluster between roughly 40–90 million and Tape B shares between 10–16 — consistent with the relatively calm, low-volatility environment that characterized much of 2014. However, several high-leverage outliers in the upper-right region (VIX low ~155–196 million, Tape B ~19–25) are visually striking and likely correspond to specific volatility events during 2014, most notably the October 2014 market selloff driven by Ebola fears and geopolitical tensions. These extreme points likely exert disproportionate influence on the regression slope and correlation coefficient, potentially inflating r. There also appears to be increased scatter at higher VIX values, suggesting heteroscedasticity — variance in Tape B shares widens as volatility rises.
Confounding Factors and Caveats Several important caveats apply. First, the axis assignment appears inverted relative to naming conventions: the VIX Index Low column comes from the market volume dataset, and Tape B Shares from the VIX dataset, which warrants careful verification of data joins and column mappings before drawing firm conclusions. Second, Tape B shares represent a specific subset of equities (NYSE American-listed securities), so the relationship may reflect sector-specific dynamics rather than broad market behavior. Third, calendar effects (end-of-quarter rebalancing, options expiration days) could simultaneously drive both VIX fluctuations and volume spikes, acting as an unobserved common driver. Finally, with N = 3,686 as the full population but only n = 252 sampled pairs, the sampling strategy should be confirmed as representative across the full volatility regime distribution.
Actionable Insights and Further Investigation Practitioners should not rely on VIX low as a next-day predictor of Tape B volume given the failed Granger causality tests — the co-movement is real but contemporaneous. Further investigation should include: (1) regime segmentation — separating calm periods (VIX < 15) from stress periods to test whether the correlation holds symmetrically; (2) outlier-robust regression (e.g., Huber or Theil-Sen) to assess whether the October volatility spike cluster is driving the apparent linear relationship; (3) examining lagged cross-correlations beyond one period to rule out longer-horizon predictive relationships; and (4) introducing intraday volume patterns or options expiration indicators as control variables to better isolate the true VIX-volume mechanism.
X dataset: Cboe U.S. Equities Historical Market Volume Data 2014
Y dataset: VIX Daily Index
Part of experiment: Daily - Cboe U.S. Equities Historical Market Volume Data 2014 vs VIX Daily Index