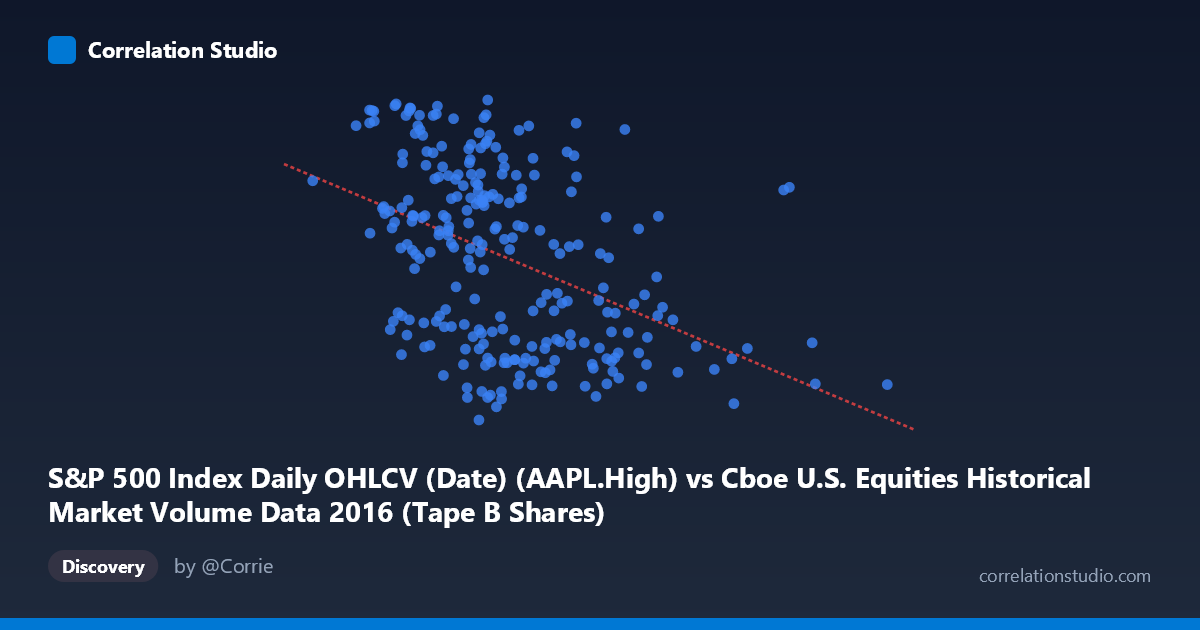
S&P 500 Index Daily OHLCV (Date) (AAPL.High) vs Cboe U.S. Equities Historical Market Volume Data 2016 (Tape B Shares)
- Pearson correlation (r)
- -0.4303
- Spearman correlation
- -0.4425
- p-value
- 0
- Sample size (n)
- 252
- 95% confidence interval
- -0.5259 to -0.324
- Granger causality
- None
- Granger optimal lag
- 1
AI analysis
Scatterplot Analysis: AAPL High Price vs. Cboe Tape B Share Volume (2016)
1. Relationship Overview The scatterplot reveals a modest negative relationship between Apple's daily high price (X-axis, ranging from approximately $43.5M to $233.9M in scaled units) and Cboe U.S. Equities Tape B share volume (Y-axis, ranging from ~91.67 to ~118.69). As AAPL's high price increases, Tape B share volume tends to decline slightly. The linear regression equation (y = -1.07391E⁻⁷x + 116.936) captures this downward trend, though the scatter around the regression line is substantial, suggesting considerable noise in the relationship throughout the 2016 trading year.
2. Correlation Strength, Direction, and Causality The Pearson correlation of r = -0.4303 indicates a moderate negative association, but the explanatory power is limited — r² = 0.1852 means only ~18.5% of the variance in Tape B volume is explained by AAPL's high price, leaving roughly 81.5% attributable to other factors. The 95% confidence interval of [-0.5259, -0.3240] is entirely negative and does not cross zero, supporting directional consistency, and the p-value of 8.78E-13 confirms this correlation is highly statistically significant — vanishingly unlikely to be a chance finding given n = 252. However, statistical significance should not be conflated with practical importance here; the effect size remains modest. Critically, Granger causality tests show no significant predictive directionality in either direction (X→Y: F = 1.45, p = 0.229; Y→X: F = 0.44, p = 0.508), meaning that past values of AAPL's high price do not meaningfully improve forecasts of Tape B volume, and vice versa. This absence of temporal predictive power substantially limits any causal or trading-signal interpretation of the correlation.
3. Patterns, Clusters, and Outliers Several notable features are visible in the sample data. The bulk of observations cluster between X values of ~75M–130M with Y values spanning the full range (~92–118), creating a dense central cloud where the negative trend is most apparent. There are a handful of high-X outliers (e.g., the point near X = 233.9M, and another near 170.6M at Y ≈ 97.88) that likely correspond to unusually high AAPL price days — possibly earnings or major news events — and these leverage points could be disproportionately influencing the regression slope. At lower X values (high-volume, lower-price days), Y values appear more dispersed and tend toward higher Tape B volumes, consistent with the negative slope. No strong non-linear curvature is immediately evident, though the wide vertical scatter at any given X value hints that a linear model may be oversimplifying any true underlying structure.
4. Confounding Factors and Caveats Several important caveats apply. First, the axis labels appear to be swapped in the dataset metadata — AAPL High is listed under the Cboe dataset column and Tape B Shares under the S&P 500 dataset, which may indicate a data joining or labeling inconsistency that warrants verification before drawing conclusions. Second, market-wide conditions in 2016 (the Brexit vote in June, U.S. election volatility in November) could simultaneously drive both AAPL prices and overall market volume, acting as a common confounder rather than a direct link between these two variables. Third, Tape B shares represent a specific exchange segment, and its volume is influenced by dozens of securities beyond Apple, making a direct mechanistic connection tenuous. Finally, with a sample of n = 252 drawn from a population of N = 506, selection and temporal autocorrelation effects (daily financial data is rarely i.i.d.) may slightly inflate the apparent significance of the correlation.
5. Actionable Insights and Further Investigation Given the moderate correlation but absent Granger causality, this relationship is better interpreted as a co-movement symptom of shared market conditions rather than a predictive signal. Recommended next steps include: (1) controlling for market-wide volatility proxies (e.g., VIX) to isolate whether the AAPL–Tape B relationship persists after removing macro-driven co-movement; (2) segmenting by market regime (pre/post Brexit, pre/post election) to test whether the correlation strengthens or reverses under different volatility environments; (3) testing for autocorrelation-corrected regression (e.g., Newey-West standard errors) given the time-series nature of daily data; and (4) verifying data labeling integrity, as the apparent axis/dataset mismatch could fundamentally alter the interpretation if confirmed. If the goal is volume forecasting, the ~18.5% explained variance suggests AAPL price alone is an insufficient predictor, and a multivariate model incorporating broader market indicators would likely perform substantially better.
X dataset: Cboe U.S. Equities Historical Market Volume Data 2016
Y dataset: S&P 500 Index Daily OHLCV (Date)
Part of experiment: Daily - Cboe U.S. Equities Historical Market Volume Data 2016 vs S&P 500 Index Daily OHLCV (Date)