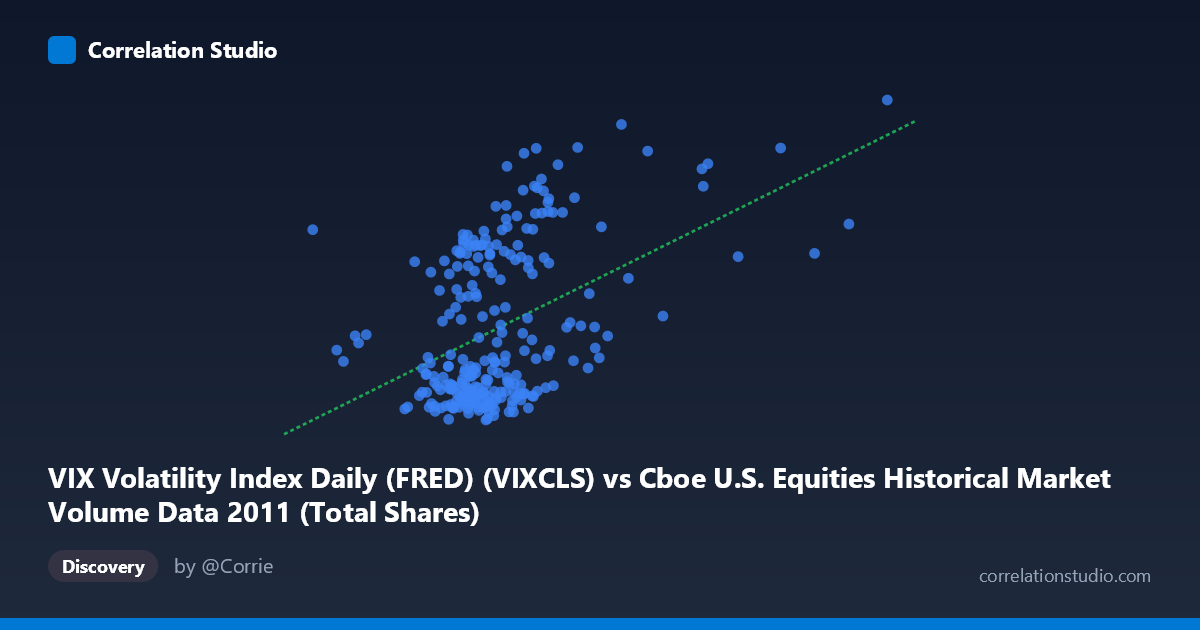
VIX Volatility Index Daily (FRED) (VIXCLS) vs Cboe U.S. Equities Historical Market Volume Data 2011 (Total Shares)
- Pearson correlation (r)
- 0.4504
- Spearman correlation
- 0.3815
- p-value
- 0
- Sample size (n)
- 252
- 95% confidence interval
- 0.3461 to 0.5437
- Granger causality
- None
- Granger optimal lag
- 1
AI analysis
Analysis: VIX Volatility Index vs. U.S. Equity Market Volume (2011)
Relationship Overview The scatterplot reveals a moderate positive relationship between U.S. equity market trading volume (X-axis, measured in shares) and the VIX Volatility Index (Y-axis), with higher trading volumes broadly associated with elevated VIX readings. The linear regression equation (y = 2.98×10⁻⁸x + 8.62) suggests that each additional billion shares traded corresponds to roughly a 30-point increase in VIX — a relationship that is intuitive given that fear-driven market turbulence typically triggers heightened trading activity. The data spans the full calendar year 2011, a period marked by notable volatility events including the U.S. debt ceiling crisis and European sovereign debt contagion, providing a naturally stress-tested environment for observing this relationship.
Correlation Strength and Statistical Significance The Pearson correlation of r = 0.45 indicates a moderate positive association, but the r² of 0.203 is the more telling statistic: only ~20% of the variance in VIX is explained by trading volume, meaning roughly 80% of VIX fluctuations are driven by factors entirely unrelated to share volume in this dataset. The 95% confidence interval [0.35, 0.54] is reasonably tight and does not cross zero, and the p-value of 5.4×10⁻¹⁴ confirms this correlation is highly statistically significant — effectively ruling out chance given the n=252 paired observations drawn from a population of N=3,780. However, statistical significance should not be conflated with practical predictive power; the modest r² tempers enthusiasm for using volume alone as a VIX predictor. Critically, the Granger causality tests fail entirely (X→Y: F=0.064, p=0.801; Y→X: F=0.007, p=0.932), indicating that neither variable temporally predicts the other at a one-period lag — the correlation is contemporaneous rather than predictive, which substantially limits its utility for forecasting.
Patterns, Clusters, and Outliers The scatterplot exhibits several visually distinct features. There appears to be a dense cluster at lower volume levels (~400–550M shares) with VIX readings between 15–25, representing typical "calm market" days that dominate the year. A secondary, more dispersed cluster emerges at higher VIX values (30–45), corresponding to the stress periods of mid-to-late 2011 when both variables elevated together. Several notable outliers are visible at the upper-right region — points such as (878M shares, VIX 39.0) and (588M shares, VIX 43.0) — likely corresponding to the acute August 2011 market panic following the S&P credit downgrade of U.S. debt. The relationship also appears heteroscedastic: variance in VIX is considerably wider at moderate volume levels, while extreme volume days cluster more tightly around high VIX, suggesting a possible non-linear or threshold dynamic that a simple linear model may underfit.
Confounding Factors and Caveats Several important caveats apply. First, 2011 was an atypically volatile year, featuring multiple idiosyncratic macro shocks (debt ceiling, eurozone crisis, Arab Spring), which may have inflated the correlation beyond what would be observed in calmer periods — the relationship may not generalize. Second, reverse causality is plausible: elevated VIX may drive trading volume (investors rebalancing, hedging, or liquidating during fear spikes) rather than volume driving VIX, though the Granger tests suggest neither direction dominates at a one-day lag. Third, intraday composition of volume matters — high-frequency, algorithmic, or ETF rebalancing flows may inflate share counts without reflecting genuine fear-driven activity, diluting the relationship. Fourth, the axis labeling in the metadata appears transposed (the dataset descriptions swap which column belongs to which axis), which warrants verification before drawing firm conclusions from the regression coefficients.
Actionable Insights and Further Investigation Given the moderate correlation and absent Granger causality, practitioners should avoid using single-day volume changes as a leading indicator of VIX movements. More productive avenues would include: (1) testing non-linear models (e.g., regime-switching or quantile regression) to better capture the threshold behavior visible in the upper-right cluster; (2) stratifying by market regime (calm vs. crisis periods) to assess whether the correlation strengthens materially during stress episodes, which could still have tactical hedging value; (3) extending the time series across multiple years and volatility regimes to test whether the r≈0.45 finding is stable or an artifact of 2011's unique macro environment; and (4) incorporating options market volume or put/call ratios alongside equity share volume, as these may carry richer contemporaneous signals about the fear premium embedded in VIX. The strong statistical significance at modest r² is itself a finding worth reporting — it confirms a real but limited structural link between market activity and implied volatility.
X dataset: Cboe U.S. Equities Historical Market Volume Data 2011
Y dataset: VIX Volatility Index Daily (FRED)
Part of experiment: Daily - Cboe U.S. Equities Historical Market Volume Data 2011 vs VIX Volatility Index Daily (FRED)