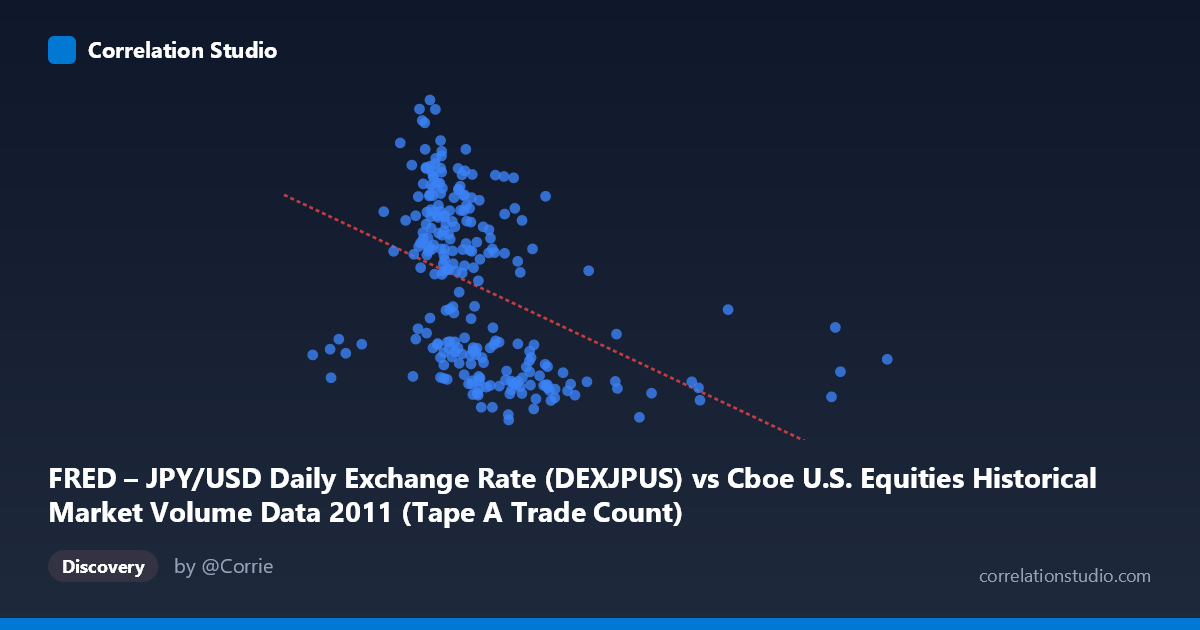
FRED – JPY/USD Daily Exchange Rate (DEXJPUS) vs Cboe U.S. Equities Historical Market Volume Data 2011 (Tape A Trade Count)
- Pearson correlation (r)
- -0.4222
- Spearman correlation
- -0.5744
- p-value
- 0
- Sample size (n)
- 250
- 95% confidence interval
- -0.5191 to -0.3147
- Granger causality
- None
- Granger optimal lag
- 1
AI analysis
Analysis: JPY/USD Exchange Rate vs. Cboe U.S. Equities Trade Count (2011)
1. What the Visualization Reveals
The scatterplot depicts a modest negative relationship between U.S. equities market trade volume (X-axis: daily notional/volume values) and the JPY/USD exchange rate (Y-axis: Japanese Yen per U.S. Dollar) across 2011. As equity market volume increases, the JPY/USD rate tends to decline — meaning the U.S. dollar weakens relative to the yen (since a lower JPY/USD number means fewer yen per dollar, i.e., a stronger yen). The data cloud is notably wide, with considerable scatter around the regression line (y = -3.328E-6x + 83.67), suggesting the linear relationship, while statistically real, is far from deterministic. The bulk of observations cluster in the lower X range (roughly 800,000–1,500,000), with a long right tail of high-volume outlier days.
2. Correlation Strength, Direction, and Temporal Predictability
The Pearson correlation of r = -0.422 indicates a moderate negative association, but the critical framing comes from r²: only 17.8% of the variance in JPY/USD is explained by U.S. equity trade volume. The remaining ~82% of exchange rate variation is driven by factors entirely outside this model. The 95% confidence interval of [-0.519, -0.315] is comfortably negative and does not cross zero, and the p-value of 3.13×10⁻¹² confirms this is not a chance finding given the sample of 250 paired observations from a population of ~3,780 trading days. However, the Granger causality tests are unambiguous in their null result: neither X→Y (F=0.134, p=0.714) nor Y→X (F=0.486, p=0.486) shows temporal predictive power at the optimal one-period lag. This means that while the two series are contemporaneously correlated, knowing today's equity volume tells you nothing statistically useful about tomorrow's exchange rate, and vice versa. The correlation is associative, not directionally predictive in a temporal sense.
3. Notable Patterns, Clusters, and Outliers
Several structural features stand out. The data exhibits a dense core cluster between approximately 800,000–1,400,000 on X and 76–85 on Y, where the negative trend is most visible. There is a pronounced right-tail extension with extreme volume observations — notably points near X = 2,251,823, 2,925,714, and 2,098,018 — all of which show JPY/USD values in the 76–79 range, consistent with the regression slope but representing potentially anomalous high-volume days (perhaps driven by market stress events in 2011, including the Tōhoku earthquake and European debt crisis volatility). The Spearman ρ exceeding Pearson r (as flagged in the regression notes) is important: it suggests the true relationship is monotonic but non-linear, meaning a logarithmic or polynomial fit would likely capture the relationship more accurately and improve explained variance beyond the 17.8% achieved linearly. The Y-axis range is also notably compressed (75.72–85.26, a spread of less than 10 yen), which amplifies the visual appearance of scatter.
4. Confounding Factors and Interpretive Caveats
The year 2011 was extraordinarily eventful for both U.S. equity markets and the JPY/USD rate, introducing substantial confounding through shared macro drivers rather than a direct causal link. The Tōhoku earthquake and tsunami (March 2011) caused simultaneous spikes in yen demand (safe-haven flows) and U.S. equity volume. The U.S. debt ceiling crisis (August 2011) similarly drove equity volume surges alongside dollar weakness. Both variables were likely responding to the same underlying risk-off events, creating spurious co-movement. Additionally, the axis labeling in the dataset appears swapped — the X column is described as originating from the Cboe volume dataset while the Y column is described as from FRED's JPY/USD data, suggesting a possible metadata inconsistency that warrants verification before drawing firm conclusions. The compressed time window (single calendar year) limits generalizability, and the long right tail in X may disproportionately influence the Pearson correlation.
5. Actionable Insights and Further Investigation
Given that Granger causality is absent and r² is modest, practitioners should not use equity volume as a predictive signal for JPY/USD in any trading or hedging strategy derived from this data alone. However, the statistically significant contemporaneous correlation does suggest both variables respond to shared latent factors — making it worthwhile to identify and model those common drivers explicitly (e.g., VIX, risk sentiment indices, Fed policy announcements). Recommended next steps include: (1) fitting a logarithmic or polynomial regression given the Spearman Pearson signal to recover additional explained variance; (2) controlling for macro events (earthquake dates, FOMC meetings, debt ceiling days) as dummy variables to isolate the residual relationship; (3) expanding the time series beyond 2011 to test whether the negative correlation persists across different market regimes; and (4) verifying the axis/dataset assignment given the apparent metadata swap between X and Y column descriptions, which could materially affect interpretation of directionality.
X dataset: Cboe U.S. Equities Historical Market Volume Data 2011
Y dataset: FRED – JPY/USD Daily Exchange Rate
Part of experiment: Daily - Cboe U.S. Equities Historical Market Volume Data 2011 vs FRED – JPY/USD Daily Exchange Rate