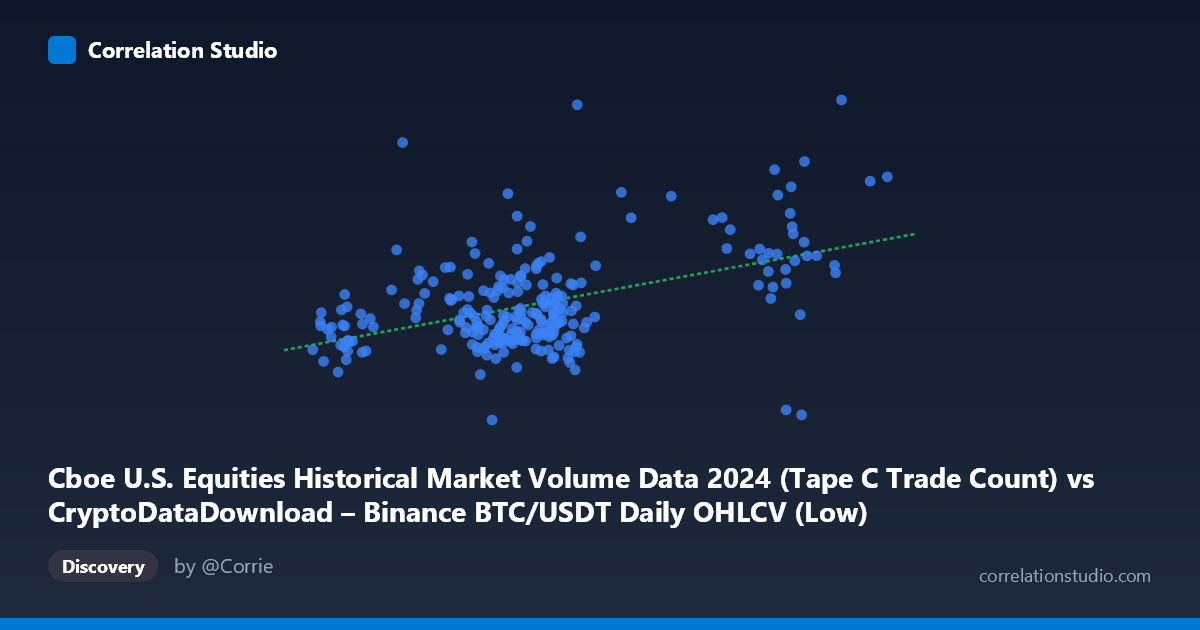
Cboe U.S. Equities Historical Market Volume Data 2024 (Tape C Trade Count) vs CryptoDataDownload – Binance BTC/USDT Daily OHLCV (Low)
- Pearson correlation (r)
- 0.47
- Spearman correlation
- 0.3327
- p-value
- 0
- Sample size (n)
- 252
- 95% confidence interval
- 0.3678 to 0.561
- Granger causality
- None
- Granger optimal lag
- 10
AI analysis
Scatterplot Analysis: Cboe Trade Count vs. BTC/USDT Daily Low
1. What the Visualization Reveals
The scatterplot shows a positive but noisy relationship between Cboe Tape C trade counts and Binance BTC/USDT daily lows. The bulk of the data clusters in the X range of ~55,000–70,000 trades, corresponding to BTC lows mostly between $1.6M and $2.4M (note: these Y values appear to be mislabeled/scaled, likely representing price × some multiplier rather than raw BTC price, but the analysis proceeds on the values as given). A secondary, more sparse cluster appears at higher X values (93,000–105,000), suggesting two distinct volume regimes in the trade-count data across the year.
2. Strength, Direction, and Statistical Confidence
The correlation coefficient (r = 0.47) indicates a moderate positive relationship, but r² = 0.221 means only about 22% of the variance in BTC daily lows is explained by Cboe trade counts — leaving nearly 78% attributable to other factors. The 95% CI [0.368, 0.561] is reasonably tight and excludes zero, and the p-value (2.9×10⁻¹⁵) confirms this correlation is highly statistically significant and not due to chance, given n=252. However, statistical significance should not be conflated with strong practical predictive power — the relationship is real but loose. Critically, the Granger causality tests show no significant predictive direction in either direction (X→Y: p=0.19; Y→X: p=0.47) at the optimal lag of 10 periods. This means neither series reliably helps forecast the other's future values based on past values — the contemporaneous correlation does not translate into temporal lead-lag predictability.
3. Notable Patterns and Outliers
Several features stand out: - Bimodal X clustering: a dense cluster near X≈55,000–70,000 and a thinner, more scattered cluster near X≈93,000–105,000, with the latter showing more Y-variance (spanning ~1.3M to 2.4M). - Low-Y outlier: the point (59,400, 1,260,224) sits well below the main cloud, representing the dataset's minimum Y value despite a mid-range X. - High-Y outlier: (49,000, 2,801,223) is a low-X, high-Y point, deviating from the general upward trend. - Within the main cluster, there's no clear tight linear band — points scatter broadly vertically at similar X values (e.g., X≈60,000–68,000 spans Y from ~1.6M to ~2.4M), reinforcing the low r².
4. Confounding Factors and Caveats
Several caveats limit causal interpretation: - Unrelated domains: Cboe U.S. equities trade counts and Binance BTC/USDT prices are structurally unrelated markets; any correlation is likely driven by a shared confound — most plausibly overall 2024 market-wide trends (rising equity trading activity and rising BTC prices both reflect a bullish, high-volume year) rather than direct interaction. - Time-series trend confound: Both series likely trended over 2024; correlating two trending time series often produces spurious correlation (a classic non-stationarity issue) unless detrended or differenced. - Scale/units concern: The Y-axis label "Low" values in the millions seem inconsistent with typical BTC/USDT daily lows (~$40K–$100K range in 2024), suggesting a possible data scaling, aggregation, or column-mapping error worth verifying. - Sampling: n=252 from a population of 3,212 — check whether sampling was random/uniform across the year, as clustering (e.g., only certain months) could bias r.
5. Actionable Insights
- Verify data integrity first, particularly the Y-axis units/scale mismatch with expected BTC price ranges. - Detrend both series (e.g., first-difference or percentage returns) and re-run correlation/Granger tests to check if the relationship is genuine or an artifact of shared upward trends in 2024. - Given the lack of Granger causality, do not use one series to forecast the other; instead, investigate a common driver (e.g., macro risk sentiment, VIX, dollar index) that might jointly explain both equity trade volume and BTC price movements. - Consider segmenting analysis by the two apparent X-clusters (normal vs. high trade-count days) to see if the relationship strengthens or differs by regime — this could reveal regime-dependent dynamics obscured in the pooled correlation.
X dataset: CryptoDataDownload – Binance BTC/USDT Daily OHLCV
Y dataset: Cboe U.S. Equities Historical Market Volume Data 2024
Part of experiment: Bitcoin - CryptoDataDownload – Binance BTC/USDT Daily OHLCV vs Cboe U.S. Equities Historical Market Volume Data 2024