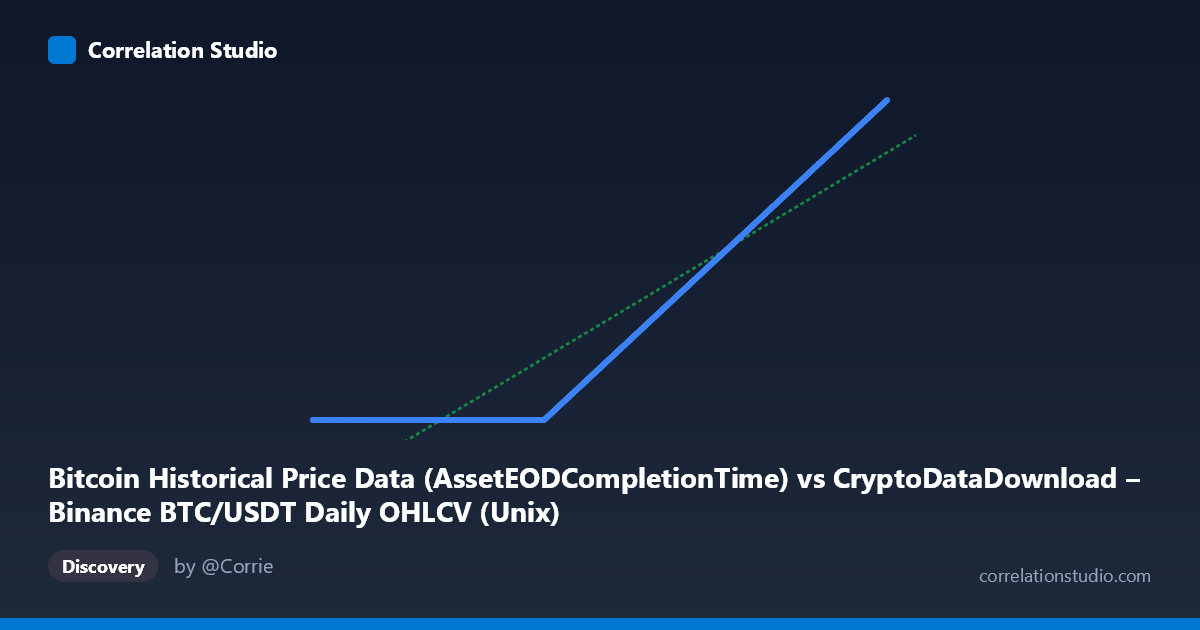
Bitcoin Historical Price Data (AssetEODCompletionTime) vs CryptoDataDownload – Binance BTC/USDT Daily OHLCV (Unix)
- Pearson correlation (r)
- 0.9386
- Spearman correlation
- 1
- p-value
- 0
- Sample size (n)
- 3191
- 95% confidence interval
- 0.9343 to 0.9426
- Granger causality
- None
- Granger optimal lag
- 10
- Time coverage
- 2017-08-17 to 2026-05-20
AI analysis
Analysis: Timestamp Correlation Artifact
What the Visualization Actually Shows
Before interpreting this as a meaningful "correlation," it's critical to recognize what these variables are: both X and Y are timestamp columns — one is the "AssetEODCompletionTime" for Bitcoin OHLCV data, and the other is labeled "(Unix)" for a supposedly separate Bitcoin metrics dataset. This is not a relationship between two independent economic or behavioral variables; it's largely a comparison of two clocks measuring the same underlying event stream (daily Bitcoin price records).
Strength of Correlation — and Why It's Misleading
The r = 0.9386 (r² = 0.881) with a vanishingly small p-value looks like a strong, highly significant relationship — but this is expected and trivial when two variables are both time-based indices of the same daily series. The 95% CI [0.934, 0.943] is tight simply because n=3,191 is large, not because there's meaningful predictive insight. The regression slope (≈0.000643) and intercept are essentially numerical artifacts of unit/scale mismatches between the two timestamp systems, not an economically interpretable relationship. The Granger causality results reinforce this: neither direction shows significance (p=0.91 and p=0.85), confirming that neither series meaningfully "predicts" the other in a temporal sense — consistent with both being near-duplicate encodings of the same timeline rather than causally linked processes.
Notable Patterns
The most striking feature in the sample data is a large cluster of Y-values pinned near 1,614,337,000 (repeating almost identically: 1614337134, 1614337310, 1614337615, 1614337791, 1614337786, 1614337901, etc.) across a wide range of X-values (from ~1503705600000 to ~1608854400000, i.e., 2017–2020). This suggests a data quality issue: many early records in the Y column appear to be stuck at or defaulted to a fixed timestamp (corresponding to ~Feb 26, 2021), likely a placeholder, null-fill, or backfill artifact, rather than genuine per-day values. Only after ~mid-2021 does Y begin tracking X closely on a near 1:1 basis (e.g., 1733616000000 → 1733712385, matching almost exactly).
Confounding Factors and Caveats
1. Same-source duplication: Both columns likely derive from the same CryptoDataDownload BTC/USDT feed, making any "correlation" tautological rather than informative about Bitcoin price dynamics. 2. Placeholder/stale values: The repeated ~1,614,337,xxx cluster inflates apparent variance in a misleading way and could distort both the correlation coefficient and regression fit. 3. Unit mismatch: X is in milliseconds; Y appears to be in seconds (standard Unix time) — the near-1:1 relationship in later years (once the placeholder issue resolves) reflects a ~1000x scale difference not accounted for in the naive regression. 4. Granger test irrelevance: Applying Granger causality to two timestamp fields is conceptually questionable — it's not testing whether Bitcoin price movements predict some other Bitcoin metric.
Recommendations
1. Clarify the actual variables: Confirm what "Y" is truly meant to represent (is it supposed to be a distinct metric, e.g., transaction time, block time, or another network metric, and the Unix timestamp is a proxy/index rather than the true variable of interest?). 2. Clean the placeholder data: Investigate and likely exclude/impute the 2017–2020 records where Y is stuck at a constant value — this is a data pipeline bug, not a real signal. 3. Re-run correlation after unit normalization: Convert both columns to the same time unit (seconds or ms) before any further statistical comparison. 4. Focus analysis on true value columns: Redirect the correlation study to actual OHLCV price/volume fields (e.g., Close price vs. network metrics) rather than timestamp-to-timestamp comparisons, which offer no economically actionable insight.
X dataset: CryptoDataDownload – Binance BTC/USDT Daily OHLCV
Y dataset: Bitcoin Historical Price Data
Part of experiment: Bitcoin - CryptoDataDownload – Binance BTC/USDT Daily OHLCV vs Bitcoin Historical Price Data