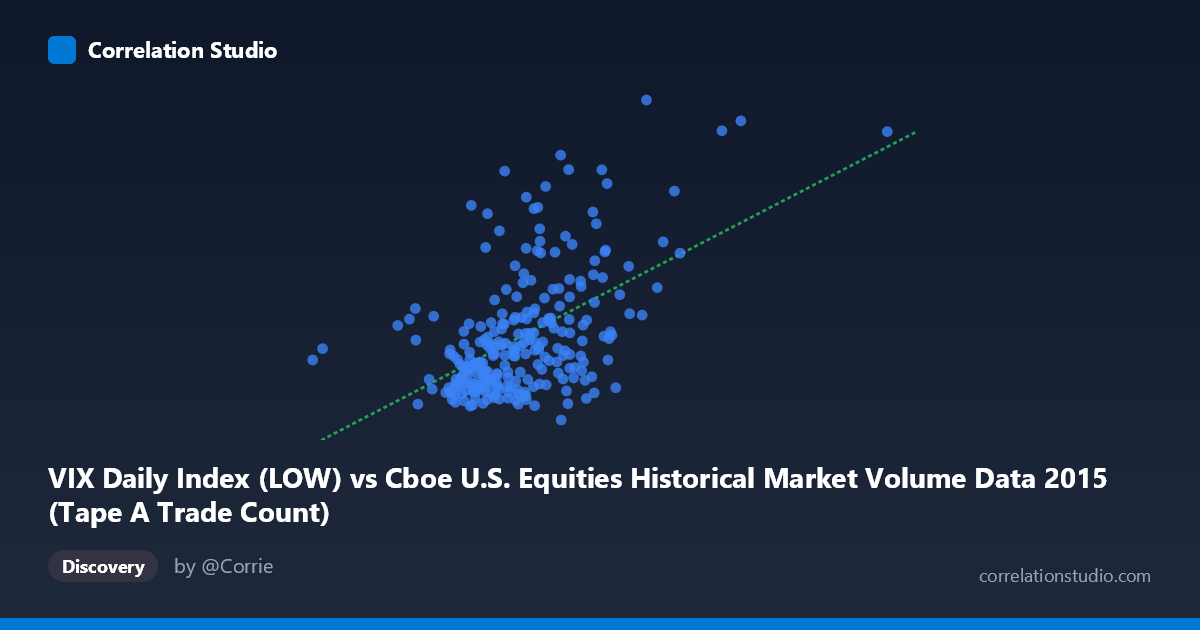
VIX Daily Index (LOW) vs Cboe U.S. Equities Historical Market Volume Data 2015 (Tape A Trade Count)
- Pearson correlation (r)
- 0.5266
- Spearman correlation
- 0.4624
- p-value
- 0
- Sample size (n)
- 252
- 95% confidence interval
- 0.4311 to 0.6105
- Granger causality
- None
- Granger optimal lag
- 1
AI analysis
Scatterplot Analysis: VIX Low vs. Tape A Trade Count (2015)
Relationship Overview The scatterplot reveals a moderate positive relationship between the VIX Daily Index Low values and the Cboe U.S. Equities Tape A Trade Count across 2015. As VIX low readings increase — indicating elevated baseline market fear or uncertainty — trade counts on Tape A tend to rise as well. This is intuitively sensible: periods of higher volatility typically drive increased trading activity as market participants react to price swings, hedge positions, or opportunistically trade momentum. The linear regression equation (y = 7.55e-6·x + 5.06) suggests that for every unit increase in the VIX low, trade count increases by a modest but consistent increment across the observed range.
Correlation Strength and Statistical Significance The Pearson correlation of r = 0.5266 indicates a moderate positive association, but the explanatory power deserves careful framing: r² = 0.2773 means only 27.7% of the variance in Tape A Trade Count is explained by VIX Low, leaving roughly 72% attributable to other factors. The 95% confidence interval of [0.4311, 0.6105] is meaningfully above zero and relatively tight given the sample size of n = 252, lending credibility to the direction and approximate magnitude of the effect. The p-value of essentially 0 confirms this relationship is highly unlikely to be a statistical artifact. However, the Granger causality tests are notably non-significant in both directions (X→Y: F = 0.087, p = 0.768; Y→X: F = 0.003, p = 0.959), meaning neither variable temporally predicts the other at a one-period lag. This is a critical caveat: while the variables move together contemporaneously, there is no evidence of one leading the other in a predictive sense.
Patterns, Clusters, and Outliers The sample points reveal several distinct structural features. The bulk of observations cluster in the VIX low range of roughly 1.1M–1.6M with trade counts between 11 and 20, forming a dense central mass. However, there is a clear upper-right cluster of high-leverage outliers — notably the point near (2,247,816; 28.08) and others in the 1.7M–2.1M range with VIX values above 20 — which visually anchor the positive slope and likely correspond to the August 2015 market volatility event (the "Flash Crash" of August 24). The point at (576,208; 14.45) at the far left represents an extreme outlier in trade volume with a relatively normal VIX reading, suggesting a data anomaly or an unusually low-volume day. Non-linearity is also plausible — the relationship may steepen at high VIX values, suggesting a threshold or regime-switching dynamic rather than a purely linear one.
Confounding Factors and Caveats Several important caveats should temper interpretation. First, 2015 is a single calendar year, and the results are heavily influenced by the August volatility episode — removing those few extreme days could substantially reduce the correlation. Second, trade count and VIX Low are driven by many common underlying forces (e.g., Federal Reserve announcements, earnings seasons, macroeconomic releases), making this a likely case of joint response to a third variable rather than a direct causal link. Third, the axes are somewhat counterintuitively assigned — VIX data appears on the X-axis from the market volume dataset, and trade counts from the VIX dataset, which may reflect a data-joining artifact worth verifying. Finally, the Granger non-causality result reinforces that this is a contemporaneous co-movement, not a leading indicator relationship, limiting its predictive utility.
Actionable Insights and Further Investigation Practitioners should not use VIX Low as a standalone predictor of next-period trade counts given the failed Granger tests. Instead, this relationship is more useful for regime characterization — identifying high-volatility environments where elevated trading volumes are expected simultaneously. For further investigation, it would be valuable to: (1) test non-linear models (e.g., log-log or piecewise regression) to better capture the apparent acceleration at high VIX levels; (2) exclude or separately analyze the August 2015 cluster to understand whether the correlation is robust outside stress periods; (3) incorporate VIX Open or Close alongside VIX Low to assess whether intraday range adds predictive value; and (4) extend the analysis to multiple years to determine whether this relationship is structurally stable or regime-dependent.
X dataset: Cboe U.S. Equities Historical Market Volume Data 2015
Y dataset: VIX Daily Index
Part of experiment: Daily - Cboe U.S. Equities Historical Market Volume Data 2015 vs VIX Daily Index