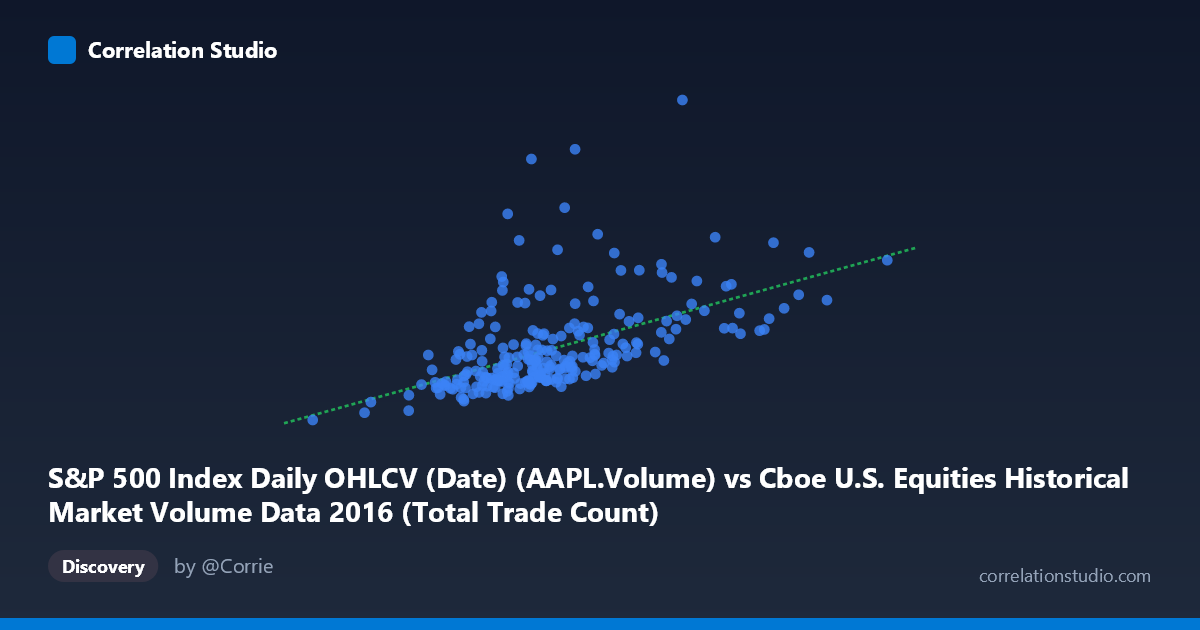
S&P 500 Index Daily OHLCV (Date) (AAPL.Volume) vs Cboe U.S. Equities Historical Market Volume Data 2016 (Total Trade Count)
- Pearson correlation (r)
- 0.5271
- Spearman correlation
- 0.6061
- p-value
- 0
- Sample size (n)
- 252
- 95% confidence interval
- 0.4316 to 0.6109
- Granger causality
- None
- Granger optimal lag
- 10
AI analysis
Scatterplot Analysis: AAPL Volume vs. Total U.S. Equity Trade Count (2016)
Relationship Overview
The scatterplot reveals a moderate positive relationship between Apple Inc.'s daily trading volume (X-axis, sourced from S&P 500 OHLCV data) and the total U.S. equity trade count across Cboe markets (Y-axis). As AAPL volume increases, total market trade counts tend to rise as well, which is visually consistent with the upward-sloping regression line (y = 17.025x − 2,811,430). This relationship is intuitive on its surface: AAPL is one of the most heavily traded equities in the U.S. market, and days of elevated AAPL activity likely coincide with broader market engagement. However, the scatter around the regression line is substantial, indicating that many other forces are shaping total trade counts beyond AAPL volume alone.
Correlation Strength, Explained Variance, and Temporal Direction
The Pearson correlation of r = 0.527 is statistically significant (p ≈ 0, n = 252), confirming a reliable positive association. However, the r² = 0.278 tells a more sobering story: AAPL volume explains only about 27.8% of the variance in total U.S. equity trade counts, leaving roughly 72% of variability unexplained by this single predictor. The 95% confidence interval for r of [0.432, 0.611] is reasonably tight, suggesting the correlation estimate is stable and not merely a sampling artifact. Critically, the Granger causality analysis finds no significant predictive direction in either sense — neither X→Y (F = 1.25, p = 0.261) nor Y→X (F = 1.01, p = 0.438) reaches significance at the optimal 10-period lag. This means that while the two series move together contemporaneously, past AAPL volume does not reliably predict future total trade counts, and vice versa, which substantially limits any causal or forecasting interpretation.
Notable Patterns, Clusters, and Outliers
The sample points reveal several notable structural features. The bulk of observations cluster in the X range of roughly 1.6M–2.8M with Y values between approximately 20M–55M, forming a relatively dense core. However, there are prominent high-Y outliers — most notably the point near (3,241,034; 133,369,700) and others around (2,509,666; 92,344,800) and (2,465,397; 76,314,700) — where total trade counts spike dramatically without a proportional surge in AAPL volume. These extreme Y values suggest episodic market-wide events (e.g., volatility spikes, macro announcements, or index rebalancing) that drive overall market activity largely independent of AAPL. Conversely, the X range extends to ~4.5M at the upper end, but the highest AAPL volume days do not consistently correspond to the highest trade counts, further weakening a clean linear story. The regression line appears to be pulled upward by these high-Y outliers, potentially inflating the slope estimate.
Confounding Factors and Caveats
Several important caveats apply. First, the axis labels appear inverted relative to dataset sources — AAPL Volume is drawn from the Cboe dataset while Total Trade Count is drawn from the S&P 500 OHLCV source, suggesting possible data joining or labeling inconsistencies that warrant verification before drawing firm conclusions. Second, both variables are likely driven by common latent factors — market volatility (VIX), macroeconomic announcements, earnings seasons, and Federal Reserve communications — meaning the observed correlation may largely reflect shared sensitivity to market conditions rather than any direct link between AAPL trading and total market activity. Third, the time coverage is a single calendar year (2016), which includes specific idiosyncratic events (U.S. presidential election, Brexit aftermath) that could create spurious or inflated correlations not generalizable to other periods. Finally, the linear model may be misspecified given the visible heteroscedasticity and outlier influence.
Actionable Insights and Further Investigation
Practitioners should treat this correlation as a descriptive market microstructure signal rather than a predictive tool, given the Granger causality null results. Further analysis should consider: (1) controlling for VIX or realized volatility as a covariate to determine how much of the r = 0.527 is absorbed by market-wide risk conditions; (2) robust regression or outlier-trimmed analysis to assess whether the extreme high-trade-count days disproportionately drive the correlation; (3) extending the time series across multiple years to test whether the relationship is stable or 2016-specific; and (4) examining other mega-cap stocks (MSFT, AMZN, GOOGL) to determine whether AAPL is uniquely correlated with total trade counts or whether this pattern is common to large-cap equities generally. A multivariate model incorporating several high-volume stocks alongside volatility measures would likely explain substantially more than the 27.8% of variance captured here.
X dataset: Cboe U.S. Equities Historical Market Volume Data 2016
Y dataset: S&P 500 Index Daily OHLCV (Date)
Part of experiment: Daily - Cboe U.S. Equities Historical Market Volume Data 2016 vs S&P 500 Index Daily OHLCV (Date)