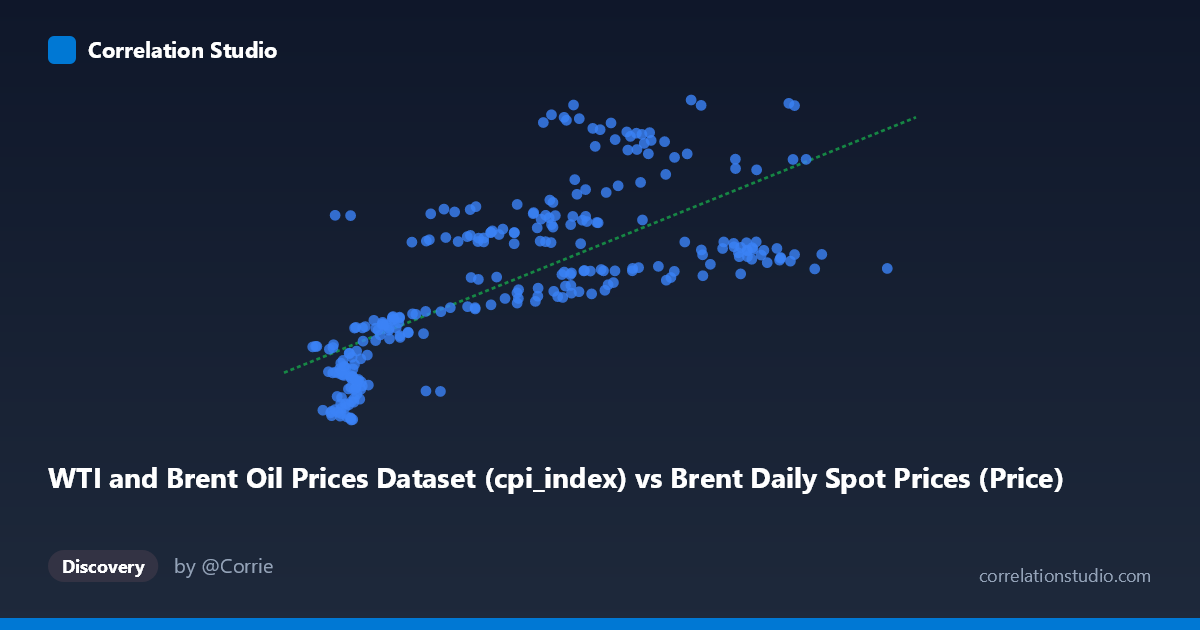
WTI and Brent Oil Prices Dataset (cpi_index) vs Brent Daily Spot Prices (Price)
- Pearson correlation (r)
- 0.7207
- Spearman correlation
- 0.7533
- p-value
- 0
- Sample size (n)
- 275
- 95% confidence interval
- 0.6586 to 0.7731
- Granger causality
- None
- Granger optimal lag
- 2
- Time coverage
- 1987-06-01 to 2026-09-01
- Recomputed on refreshed data
- 2026-10-22 (r was 0.7207)
AI analysis
Analysis: Brent CPI Index vs. WTI Real Oil Prices
Relationship Overview
The scatterplot reveals a clear positive relationship between the Brent crude oil CPI index and real (inflation-adjusted) WTI crude oil prices, which is fundamentally expected given that both variables are measuring closely related phenomena in the global oil market. As the Brent CPI index rises, WTI real prices increase in a broadly linear fashion, following the regression line y = 1.21x + 142.03. The positive slope slightly greater than 1 suggests that WTI real prices respond somewhat more than proportionally to movements in the Brent index, which may reflect differences in how CPI adjustment interacts with nominal price changes across the two series. The data spans nearly four decades (1987–2026), meaning this relationship has been tested across multiple complete oil market cycles, lending considerable temporal robustness to the observed pattern.
Correlation Strength and Statistical Significance
The correlation of r = 0.733 is moderately strong and highly statistically significant (p ≈ 0), with a tight 95% confidence interval of [0.675, 0.782] that leaves little doubt about the direction and approximate magnitude of the association. However, the r² of 0.537 is the more sobering figure: only about 53.7% of the variance in WTI real prices is explained by the Brent CPI index, meaning nearly half of the variation in WTI prices remains unexplained by this single predictor alone. This is a meaningful gap for two series that are ostensibly measuring the same underlying commodity market. The Granger causality results add an important qualification — neither series significantly predicts the other temporally (X→Y: F = 1.23, p = 0.300; Y→X: F = 1.62, p = 0.169), even at an optimal lag of 4 periods. This means the correlation is largely contemporaneous rather than predictive, and neither variable can reliably be used to forecast the other in a lead-lag framework. The relationship reflects co-movement, not directional causation.
Notable Patterns, Clusters, and Outliers
The sample points reveal at least two visually distinct behavioral regimes. A dense lower-left cluster exists where X values fall below roughly 30 and Y ranges between approximately 113–175, consistent with the low-price environment of the late 1980s and 1990s. A second, more dispersed upper cluster appears for X values between 50–130 and Y between 190–330, reflecting the post-2000 commodity supercycle and subsequent volatility. Several notable outliers are visible: points such as (62.37, 320.62) and (75.30, 315.63) sit substantially above the regression line, suggesting episodes where WTI real prices were elevated well beyond what the Brent CPI index alone would predict — likely corresponding to geopolitical supply shocks or speculative episodes. Conversely, points like (108.84, 231.25) and (110.84, 237.50) fall below the line for high X values, potentially reflecting periods of demand destruction or global recession dampening WTI prices relative to the Brent benchmark level. The scatter also visibly widens at higher X values, suggesting heteroscedasticity — the variance in WTI prices increases as the Brent index rises, which violates standard OLS assumptions and could distort confidence intervals for predictions at higher price levels.
Confounding Factors and Interpretive Caveats
Several important caveats apply. First, both variables are transformations of oil prices — one CPI-adjusted WTI and the other a Brent spot price index — so much of the correlation may reflect shared nominal price movements rather than independent information. This introduces a degree of circularity: the two series are not truly independent economic quantities. Second, CPI adjustment introduces inflation as a latent confound; periods of high inflation will deflate real WTI prices even when nominal prices rise, potentially distorting the relationship. Third, the Brent-WTI spread itself is not constant — it has historically varied from near parity to over $20/barrel depending on infrastructure bottlenecks (e.g., the 2011–2013 Cushing, Oklahoma pipeline constraints), meaning the two series can decouple meaningfully during specific periods. Fourth, the 39-year time span encompasses structurally different oil markets — OPEC quota regimes, the shale revolution, COVID-19 demand collapse, and energy transition pressures — each of which may represent a distinct structural regime where the relationship parameters differ.
Actionable Insights and Further Investigation
Given the ~46% unexplained variance and the absence of Granger causality, the Brent CPI index alone is an insufficient predictor of real WTI prices for forecasting purposes. A natural next step would be to test for structural breaks using Chow or Bai-Perron tests at known market regime changes (e.g., 2008 financial crisis, 2014 oil price collapse, 2020 COVID shock) to determine whether distinct regression relationships exist across sub-periods. Incorporating additional predictors — such as the Brent-WTI spread, OPEC production quotas, USD exchange rate indices, and global demand proxies — into a multivariate model would likely push r² substantially higher. Given the visible heteroscedasticity, log-transforming both variables or applying weighted least squares should be explored to improve model fit at high price levels. Finally, the lack of Granger causality warrants investigation using cointegration analysis (e.g., Engle-Granger or Johansen tests), since the series may share a long-run equilibrium even without short-term predictive directionality — a distinction critical for policy and trading applications.
X dataset: Brent Daily Spot Prices
Y dataset: WTI and Brent Oil Prices Dataset
Part of experiment: Daily - Brent Daily Spot Prices vs WTI and Brent Oil Prices Dataset