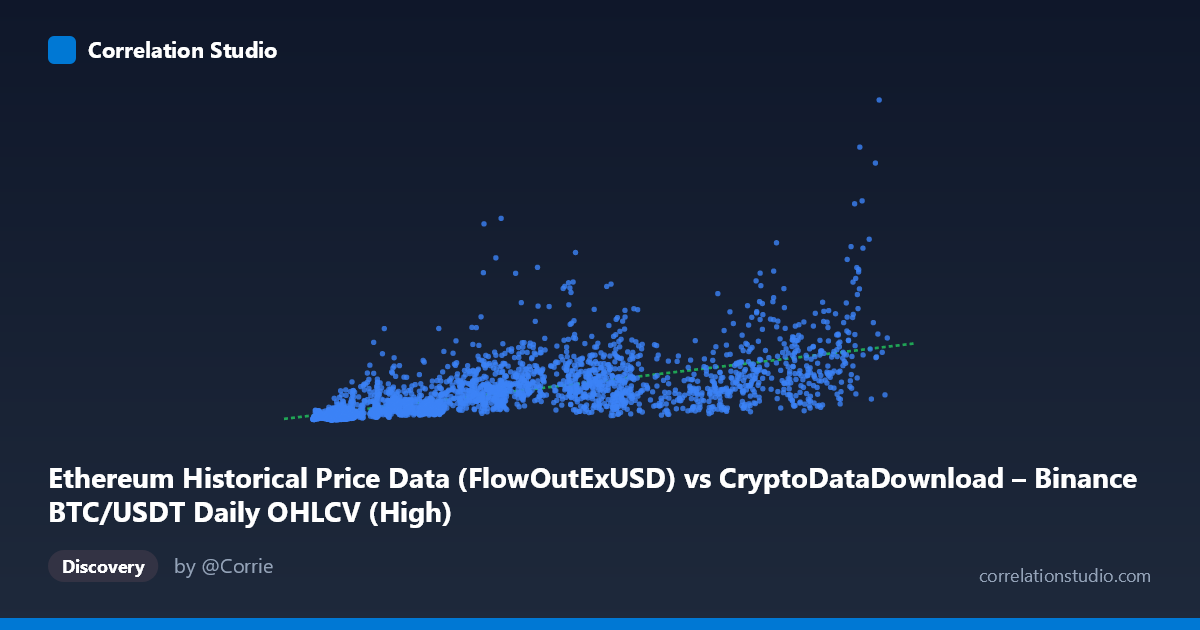
Ethereum Historical Price Data (FlowOutExUSD) vs CryptoDataDownload – Binance BTC/USDT Daily OHLCV (High)
- Pearson correlation (r)
- 0.6645
- Spearman correlation
- 0.8283
- p-value
- 0
- Sample size (n)
- 3191
- 95% confidence interval
- 0.6447 to 0.6834
- Granger causality
- Y → X
- Granger optimal lag
- 10
AI analysis
Analysis: BTC/USDT FlowOutExUSD (X) vs. Ethereum Daily High Price (Y)
1. What the Visualization Reveals
The scatterplot shows a moderate positive association between the X variable (labeled as ETH FlowOutExUSD, though the mixed column naming suggests possible data-labeling ambiguity between BTC and ETH series) and Y (Binance BTC/USDT daily high). As X increases from roughly 3,300 to 126,000, Y trends upward from the tens of millions into the billions, but the relationship is loose and noisy rather than a tight linear band. Points are scattered widely at every X level — for example, X values near 60,000–70,000 correspond to Y values ranging from ~450 million to over 1.6 billion — indicating substantial dispersion around any fitted trend line.
2. Strength, Direction, and Statistical Confidence
The Pearson correlation (r = 0.6645, r² = 0.4416) indicates a moderate positive linear relationship, with only about 44% of the variance in Y explained by X — meaning more than half of Y's variability is driven by other factors or nonlinear dynamics not captured by this simple linear model. The 95% CI [0.6447, 0.6834] is tight given the large sample (n=3,191), and the p-value of ~0 confirms the correlation is highly statistically significant and not due to chance. However, statistical significance here reflects sample size more than practical predictive strength — r² of 0.44 leaves considerable unexplained variance for any forecasting application.
The Granger causality results add an important temporal dimension: Y Granger-causes X, not the other way around (Y→X: F=2.02, p=0.028; X→Y: F=1.45, p=0.153, not significant). This suggests that past values of Y (BTC price) have modest predictive power for future values of X, but not vice versa. This is a directional, statistical (not necessarily causal in the economic sense) relationship — likely reflecting BTC's role as a market-leading price signal that other crypto-denominated metrics tend to follow with a lag of up to 10 periods.
3. Notable Patterns and Non-linear Features
The note that Spearman ρ exceeds Pearson r is a key signal: the relationship is monotonic but not well-captured by a straight line. Visually, this likely manifests as a fan-shaped or curved scatter — tighter clustering at low X values and increasing vertical spread (heteroscedasticity) at higher X values, consistent with multiplicative or exponential growth dynamics common in financial/crypto data. A few points stand out as high-leverage: X≈41,100 paired with Y≈1.31 billion, and X≈56,758 with Y≈1.40 billion, sit well above the regression line, while X≈90,741 with Y≈303 million sits well below it — suggesting outliers or regime shifts (e.g., periods of decoupling between BTC and ETH prices) rather than a single stable relationship across the full range. A log-log or polynomial transformation would likely improve fit and reduce this fan pattern.
4. Confounding Factors and Caveats
Several caveats are important: - Data labeling inconsistency: the X-axis is described as "Ethereum...FlowOutExUSD" but the dataset name references BTC/USDT OHLCV, while Y is explicitly BTC/USDT High — this mismatch raises concern about whether X and Y are properly aligned or whether metadata errors exist. - Shared market macro-trends: BTC and ETH prices (and related flow metrics) are both driven by common external factors — overall crypto market sentiment, USD liquidity, regulatory news, and Bitcoin's dominance effect — making the observed correlation likely reflect co-movement due to shared drivers rather than a direct causal link. - Non-stationarity: crypto price series over 2017–2026 span multiple bull/bear cycles; both variables likely trend together over time (time-based confounding), which can inflate correlation without indicating a stable structural relationship. - Granger causality ≠ true causation: it only indicates predictive lead-lag structure in the statistical sense, not a mechanistic driver.
5. Actionable Insights
1. Verify data provenance — confirm the X-axis column truly represents the intended Ethereum-related exchange flow metric and not a mislabeled BTC series, given the dataset name mismatch. 2. Model nonlinearity — fit log-log or polynomial regression given the Spearman/Pearson divergence; this should improve r² and better characterize the true functional form. 3. Exploit the Granger direction — since Y (BTC price) leads X with a 10-period lag, consider using lagged BTC prices as a predictive feature for whatever X truly represents, validating with out-of-sample forecasting tests. 4. Control for time trend — run the correlation on detrended or differenced series (e.g., returns instead of levels) to rule out spurious correlation from shared long-term market growth. 5. Investigate outlier periods (e.g., X≈41,100 and X≈90,741) — these may correspond to specific market events (crashes, exchange outflow surges) worth a case-study deep dive.
X dataset: CryptoDataDownload – Binance BTC/USDT Daily OHLCV
Y dataset: Ethereum Historical Price Data
Part of experiment: Bitcoin - CryptoDataDownload – Binance BTC/USDT Daily OHLCV vs Ethereum Historical Price Data