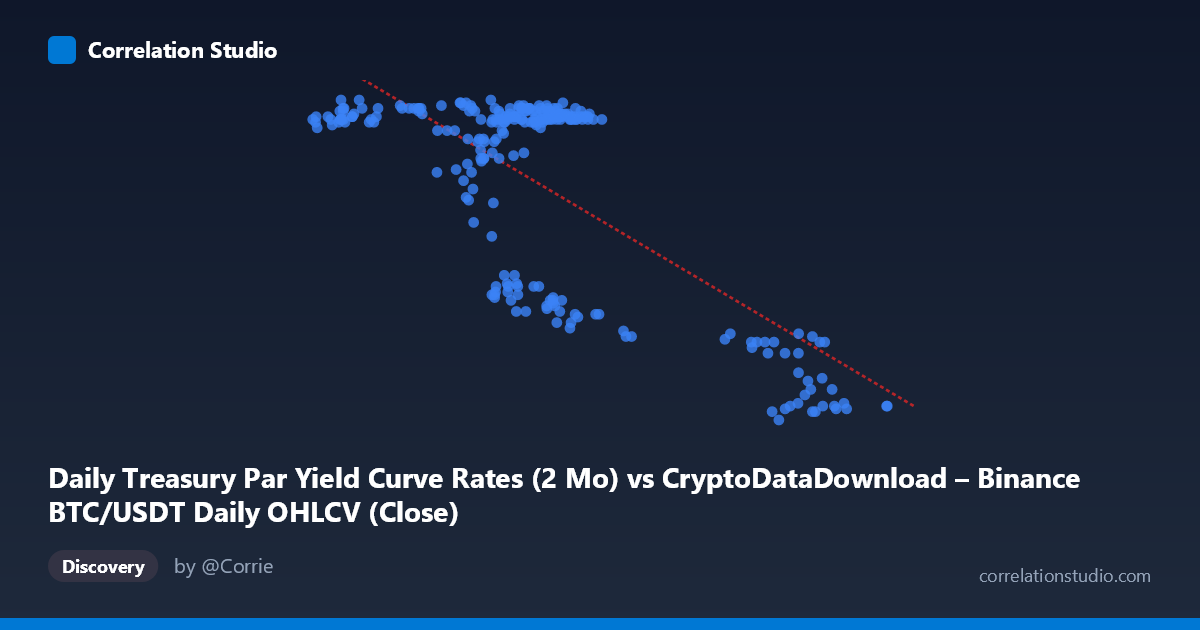
Daily Treasury Par Yield Curve Rates (2 Mo) vs CryptoDataDownload – Binance BTC/USDT Daily OHLCV (Close)
- Pearson correlation (r)
- -0.7284
- Spearman correlation
- -0.4391
- p-value
- 0
- Sample size (n)
- 250
- 95% confidence interval
- -0.7818 to -0.6643
- Granger causality
- None
- Granger optimal lag
- 1
AI analysis
Analysis of the Relationship Between Treasury Yield Data and BTC/USDT Metrics
1. Overview of the Relationship
The scatterplot reveals a clear negative, non-linear relationship between the two variables. Rather than a smooth linear decline, the data appears to cluster into distinct groups: a dense cluster of points where X ranges roughly 39,000–70,000 and Y sits high (5.3–5.5), and a smaller, more dispersed cluster where X exceeds ~85,000 and Y drops sharply to 4.4–4.7. This bimodal clustering suggests a threshold or regime-shift pattern rather than a continuous linear decay, even though a linear fit captures a moderate share of the variance.
2. Strength, Direction, and Statistical Confidence
The Pearson correlation of r = -0.7284 indicates a strong negative linear association, with r² = 0.5305 meaning roughly 53% of the variance in Y is statistically explained by X (and vice versa) — leaving nearly half unexplained, likely driven by the regime-like clustering noted above. The 95% confidence interval [-0.7818, -0.6643] is tight and entirely negative, and the p-value of ~0 confirms this relationship is highly unlikely to be due to chance given n=250. However, the Granger causality tests show no significant predictive direction (X→Y: p=0.379; Y→X: p=0.552). This is an important distinction: the variables move together contemporaneously, but neither reliably predicts future values of the other in a time-series sense. This suggests the correlation may reflect a shared external driver or coincident macro trend rather than a direct causal lag relationship.
3. Notable Patterns and Outliers
The most striking feature is the two-cluster structure: the majority of points (X < 70,000) form a tight, high-Y band with limited scatter (Y mostly 5.4–5.5), while a second, sparser cluster (X 85,000) shows Y collapsing to 4.4–4.7. There's also a transitional/intermediate zone (X ≈ 70,000–100,000) with more scattered Y values (4.4–4.9), suggesting a nonlinear "step-down" rather than gradual decline. A few points within the main cluster (e.g., Y ≈ 4.7–4.9 at X ≈ 63,000–69,000) appear as mild outliers, deviating from the tight high-X/high-Y pattern — these may correspond to specific dates with unusual short-term volatility.
4. Confounding Factors and Caveats
Since the data spans a full calendar year (2024-01-02 to 2024-12-31), both series likely share time-based trends (e.g., Fed rate policy shifts, macro liquidity cycles affecting both Treasury yields and crypto prices) that could create spurious correlation without direct causation. Treasury yields and BTC closing prices are both influenced by broader risk-sentiment and monetary-policy regimes — a classic confounding scenario. Additionally, the clustering pattern hints that the relationship may be driven by a small number of distinct time periods (e.g., a rate-hike/rate-cut phase) rather than a stable, continuous relationship holding throughout the year. The lack of Granger causality further supports the idea that this is a correlation of co-movement, not prediction.
5. Suggestions for Further Investigation
Given the clustering and non-linear appearance, consider fitting piecewise or segmented regression models (or a spline) to check if a two-regime structure fits significantly better than the single linear model. Investigate whether the clusters correspond to specific calendar periods (e.g., pre/post a Fed rate decision) by color-coding points by date. Since Granger causality is insignificant at lag 1, test additional lags (e.g., 5, 10, 30 days) to rule out longer-term lead-lag effects. Finally, given known confounders, a multivariate analysis incorporating other macro variables (e.g., DXY, inflation prints, Fed funds rate) would help clarify whether this bivariate correlation is spurious or reflects a genuine economic linkage.
X dataset: CryptoDataDownload – Binance BTC/USDT Daily OHLCV
Y dataset: Daily Treasury Par Yield Curve Rates
Part of experiment: Bitcoin - CryptoDataDownload – Binance BTC/USDT Daily OHLCV vs Daily Treasury Par Yield Curve Rates