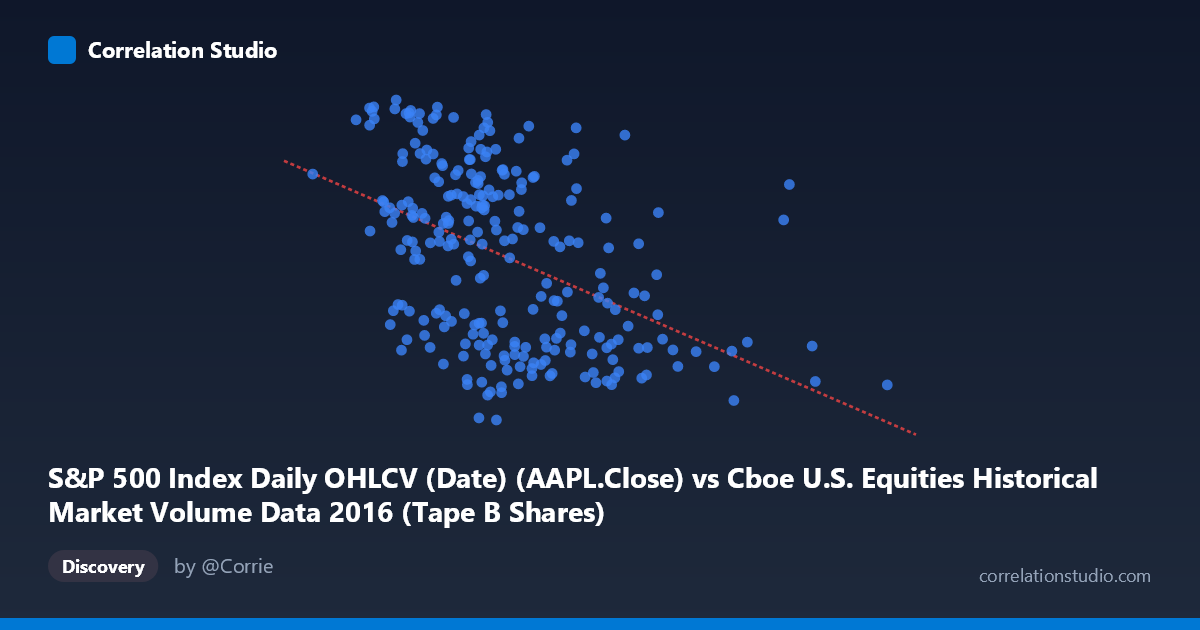
S&P 500 Index Daily OHLCV (Date) (AAPL.Close) vs Cboe U.S. Equities Historical Market Volume Data 2016 (Tape B Shares)
- Pearson correlation (r)
- -0.4519
- Spearman correlation
- -0.4678
- p-value
- 0
- Sample size (n)
- 252
- 95% confidence interval
- -0.5451 to -0.3478
- Granger causality
- None
- Granger optimal lag
- 1
AI analysis
Analysis: AAPL Close Price vs. Cboe Tape B Share Volume (2016)
Relationship Overview The scatterplot reveals a negative relationship between Apple's closing stock price (X-axis) and Cboe Tape B share volume (Y-axis) across 252 trading days in 2016. As AAPL's closing price increases, Tape B share volume tends to decrease. The linear regression equation (y = -1.14×10⁻⁷x + 116.828) quantifies this inverse trend, suggesting that for every ~$8.77 increase in AAPL's price, Tape B volume decreases by approximately 1 unit. This pattern may reflect broader market dynamics where rising equity prices correlate with reduced trading urgency or rotational shifts in volume across exchange tapes.
Correlation Strength and Statistical Significance The Pearson correlation of r = -0.452 indicates a moderate negative relationship, but the explanatory power is modest: r² = 0.204, meaning only about 20.4% of the variance in Tape B volume is explained by AAPL's closing price. The remaining ~80% is driven by other factors entirely. The 95% confidence interval of [-0.545, -0.348] is meaningfully negative and does not cross zero, and the p-value of 4.35×10⁻¹⁴ confirms this correlation is highly statistically significant — almost certainly not due to chance given n = 252. However, statistical significance here reflects the robustness of detecting a relationship, not the practical magnitude of that relationship, which remains limited.
Temporal Predictive Direction: Granger Causality Despite the statistically significant contemporaneous correlation, Granger causality analysis reveals no significant predictive directionality in either direction at the optimal lag of 1 period. Neither X→Y (F = 0.949, p = 0.331) nor Y→X (F = 0.387, p = 0.534) reaches significance. This is a critical nuance: while the two variables move together inversely within days, knowing yesterday's AAPL price does not meaningfully help predict today's Tape B volume, and vice versa. This effectively rules out simple lagged trading mechanisms and suggests the correlation is largely contemporaneous — driven by shared daily macro conditions rather than one variable leading the other.
Patterns, Clusters, and Outliers The sample points exhibit substantial vertical scatter across all X values, reinforcing the weak-to-moderate explanatory power. Several notable features emerge: there is a visible cluster of observations in the X range of ~$75M–$110M with highly dispersed Y values (roughly 92–118), suggesting high volume days show no consistent price level. A few potential outliers appear at the high end of the X range (e.g., points near $170M and $233M), which correspond to AAPL price extremes in 2016 (the stock ranged from a post-correction low near $93 to highs near $118). The spread also appears slightly wider at lower price levels, hinting at possible heteroscedasticity — volume variability may be higher when prices are depressed.
Caveats, Confounds, and Further Investigation Several important caveats apply. First, the axis labels appear swapped in the dataset descriptions — the X-axis is labeled as originating from the Cboe volume dataset but contains AAPL close prices, and vice versa, suggesting a metadata inconsistency worth verifying. Second, Tape B volume specifically covers NYSE American and regional exchanges, which may have distinct structural drivers (ETF activity, institutional routing preferences) unrelated to AAPL price movements. Third, the correlation likely reflects shared macroeconomic drivers — risk-off periods in 2016 (e.g., early-year volatility, Brexit, U.S. election) simultaneously depressed AAPL prices and elevated overall market volume, creating a spurious-looking inverse pattern. For further investigation, it would be valuable to: (1) decompose volume by market regime using a volatility index like VIX as a control variable; (2) test whether the relationship holds after removing macro event windows; and (3) examine whether other large-cap S&P 500 stocks exhibit the same inverse pattern with Tape B volume, which would confirm a systemic rather than AAPL-specific effect.
X dataset: Cboe U.S. Equities Historical Market Volume Data 2016
Y dataset: S&P 500 Index Daily OHLCV (Date)
Part of experiment: Daily - Cboe U.S. Equities Historical Market Volume Data 2016 vs S&P 500 Index Daily OHLCV (Date)