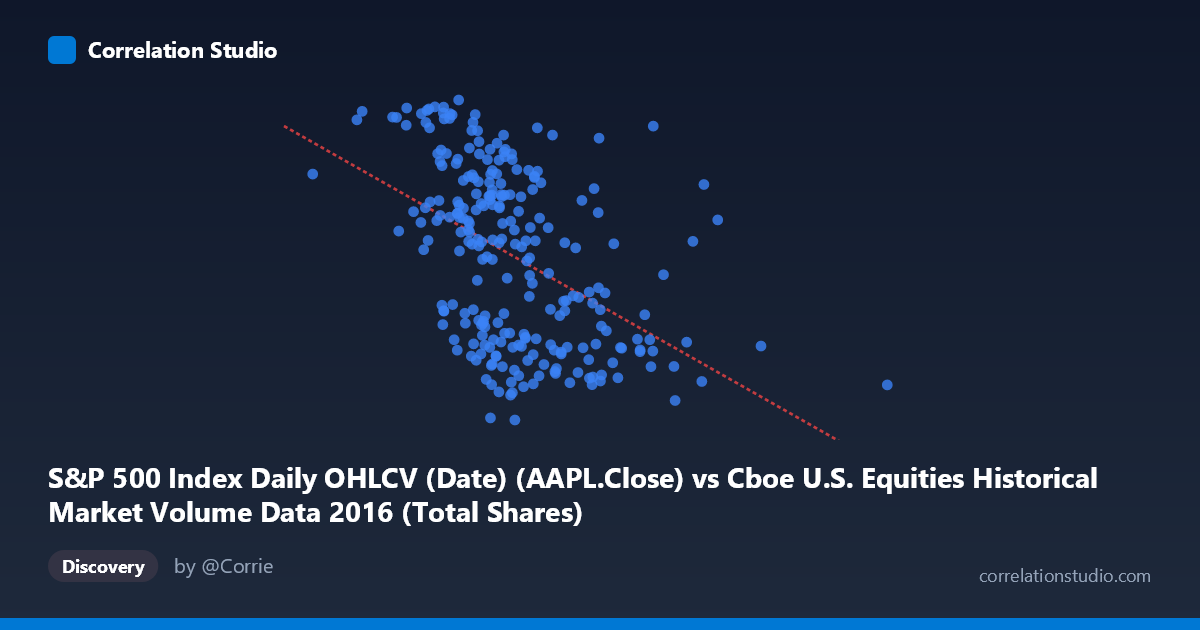
S&P 500 Index Daily OHLCV (Date) (AAPL.Close) vs Cboe U.S. Equities Historical Market Volume Data 2016 (Total Shares)
- Pearson correlation (r)
- -0.4657
- Spearman correlation
- -0.4969
- p-value
- 0
- Sample size (n)
- 252
- 95% confidence interval
- -0.5572 to -0.3631
- Granger causality
- None
- Granger optimal lag
- 1
AI analysis
Scatterplot Analysis: AAPL Close Price vs. Cboe Total Shares Volume (2016)
Relationship Overview The scatterplot reveals a moderate negative relationship between Apple's closing stock price (X-axis) and total shares traded across Cboe U.S. equity markets (Y-axis) throughout 2016. As AAPL's closing price increases, total market share volume tends to decline, and vice versa. The linear regression equation (y = -3.19E-08x + 120.947) confirms this inverse slope, meaning that for every ~31-point increase in AAPL's price, total shares volume is predicted to decrease by approximately 1 unit. Visually, the data points form a downward-sloping cloud, though with considerable scatter, suggesting the relationship is real but far from deterministic.
Correlation Strength and Statistical Significance The Pearson correlation of r = -0.4657 indicates a moderate negative association — meaningful but not dominant. More informatively, r² = 0.2169, meaning AAPL's closing price explains only about 21.7% of the variance in total shares traded, leaving roughly 78% attributable to other factors. The 95% confidence interval of [-0.5572, -0.3631] is entirely below zero, providing strong directional confidence, and the p-value of 5.77E-15 is highly statistically significant across the 252 paired observations, making random chance an implausible explanation. However, statistical significance here is partly a function of the large sample size (N=506), so practical significance deserves separate scrutiny. Crucially, Granger causality tests show no significant predictive directionality in either direction (X→Y: F=0.57, p=0.45; Y→X: F=1.42, p=0.24), meaning that knowing AAPL's price today does not meaningfully improve predictions of tomorrow's total volume, and vice versa. The correlation reflects co-movement, not temporal causation.
Notable Patterns, Clusters, and Outliers Several structural features are visible in the data. The bulk of observations cluster in the AAPL price range of ~$90–$120, consistent with the stock's 2016 trading range, while total shares volume spans roughly 90–118 units. There appear to be at least two loose clusters: one at lower AAPL prices (~$90–$100) associated with higher volume, and another at moderate prices (~$105–$115) with more dispersed volume readings. A few potential outliers are notable — for instance, the point near (369M, 117.06) represents unusually high volume at a relatively low AAPL price, and the point near (514M, 90.34) shows the lowest volume in the sample. The horizontal spread also includes some extreme X-values (e.g., ~$1.09B range maximum), suggesting possible data irregularities or axis scaling issues worth investigating.
Confounding Factors and Caveats Several important caveats apply. First, the axis labels appear swapped in the dataset metadata — the X-axis is labeled as AAPL closing price but drawn from the Cboe volume dataset, and Y-axis as total shares from the S&P 500 OHLCV dataset, which warrants careful verification. Second, the relationship may be spurious or driven by shared seasonal and macroeconomic factors: both AAPL's price and broad market volume are influenced by market-wide volatility regimes, earnings seasons, Federal Reserve announcements, and broader risk-on/risk-off dynamics in 2016 (including Brexit and the U.S. election). Third, omitted variable bias is substantial given the low r² — factors like VIX levels, sector rotation, and institutional trading calendars likely explain much of the remaining variance.
Actionable Insights and Further Investigation Given the moderate correlation without Granger causality, practitioners should avoid using AAPL price as a leading indicator for total market volume — the relationship is contemporaneous, not predictive. Further investigation should include: (1) controlling for market volatility (VIX) to test whether the correlation persists after removing a common driver; (2) segmenting by time period (pre/post U.S. election in November 2016) to detect structural breaks; (3) testing non-linear models (e.g., polynomial or spline regression) to see if the relationship has threshold effects at extreme price levels; and (4) validating the dataset join and column alignment, given the apparent metadata inconsistency between source datasets. A multivariate regression incorporating broader market indices alongside AAPL price would likely substantially improve the explained variance beyond the current 21.7%.
X dataset: Cboe U.S. Equities Historical Market Volume Data 2016
Y dataset: S&P 500 Index Daily OHLCV (Date)
Part of experiment: Daily - Cboe U.S. Equities Historical Market Volume Data 2016 vs S&P 500 Index Daily OHLCV (Date)