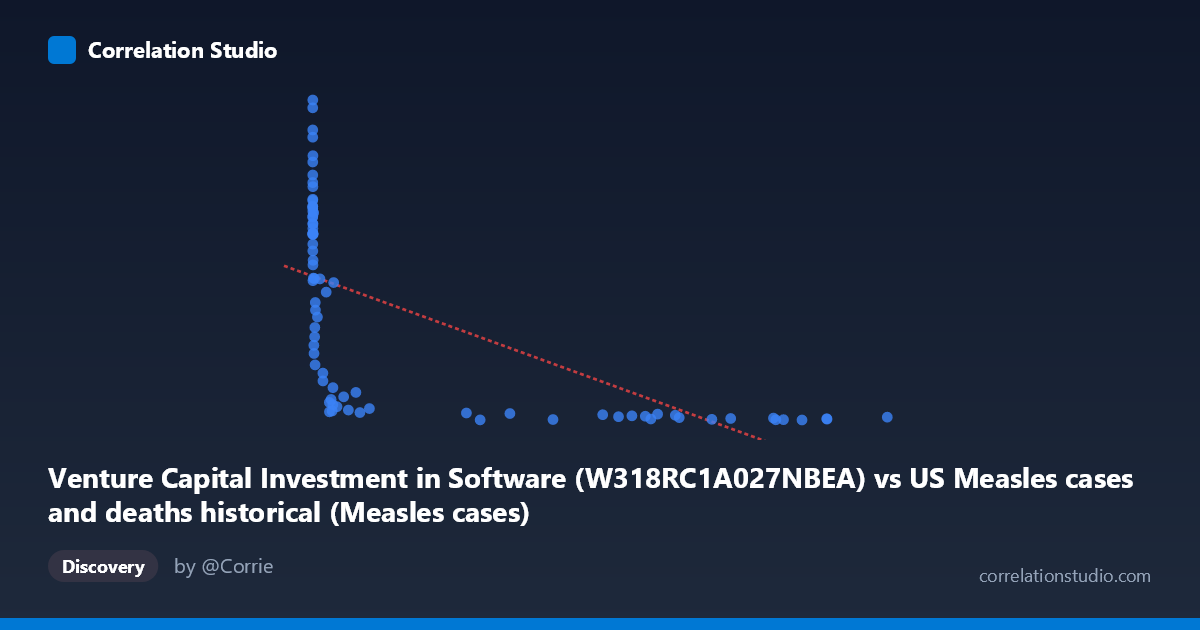
Venture Capital Investment in Software (W318RC1A027NBEA) vs US Measles cases and deaths historical (Measles cases)
- Pearson correlation (r)
- -0.6295
- Spearman correlation
- -0.9442
- p-value
- 0
- Sample size (n)
- 79
- 95% confidence interval
- -0.7467 to -0.4744
- Granger causality
- None
- Granger optimal lag
- 10
- Time coverage
- 1946-01-01 to 2024-01-01
- Recomputed on refreshed data
- 2026-10-17 (r was -0.6295)
AI analysis
Analysis: Venture Capital Software Investment vs. US Measles Cases
1. What the Visualization Reveals
The scatterplot displays a negative relationship between Venture Capital Investment in Software (X-axis, ranging from $13 to $763,094 units) and US Measles cases (Y-axis, ranging from 0.85 to 466.42). The data spans 1946–2024, and the pattern immediately suggests a temporal coincidence: both variables are strongly time-dependent, with measles cases declining dramatically after vaccination programs began in the 1960s while software investment grew exponentially across the same era. The scatter is heavily right-skewed on the X-axis, with most observations clustering at low investment values and a long tail of high-investment years corresponding almost universally to very low measles counts.
2. Correlation Strength, Direction, and Statistical Context
The Pearson correlation of r = -0.6295 indicates a moderate-to-strong negative association, with R² = 0.3963, meaning roughly 39.6% of the variance in measles cases is statistically explained by software investment — a non-trivial share, but also a reminder that 60% of variance remains unexplained by this single predictor. The 95% confidence interval of [-0.7467, -0.4744] is entirely negative and reasonably tight, and the p-value of 5.15 × 10⁻¹⁰ confirms this correlation is extremely unlikely to arise by chance in a random sample. However, statistical significance here is almost entirely a function of the shared time trend, not any mechanistic link. Critically, the Granger causality results are non-significant in both directions (X→Y: F = 1.85, p = 0.078; Y→X: F = 0.88, p = 0.560), meaning neither variable temporally predicts the other beyond their mutual trend — strongly undermining any causal interpretation.
3. Notable Patterns, Clusters, and Non-Linear Features
The data exhibits a pronounced non-linear, hyperbolic structure rather than a clean linear one — consistent with the note that Spearman ρ exceeds Pearson r, suggesting a logarithmic or power-law fit would perform better. Three rough clusters are identifiable: - High measles / low investment (early decades): points like (13, 295), (37, 311), (43, 455), (55, 412) form a dense left-side cluster with high Y variability - Transitional zone (modest investment, falling cases): values like (13,597; 57) and (32,275; 20) show rapid Y decline even at moderate X - High investment / near-zero measles (modern era): a long flat band where X exceeds 200,000 but Y is consistently below ~15, with several apparent outliers (e.g., 9,643; 206) that likely represent pre-elimination anomaly years
The extreme X-axis outlier at 763,094 with Y = 4.98 and the cluster near X = 600,000–683,000 all sit near the floor of measles cases, reinforcing the floor effect in modern data.
4. Confounding Factors and Critical Caveats
This correlation is a near-textbook example of a spurious time-series correlation. Both variables are driven overwhelmingly by calendar time: measles declined due to the introduction of the measles vaccine in 1963 and subsequent immunization campaigns, while software VC investment grew due to technological and economic trends spanning the semiconductor revolution through the dot-com era and beyond. Additional confounders include: - Population growth affecting raw case counts - Reporting methodology changes across eight decades - Economic cycles affecting VC disbursement independently of public health - Non-stationarity of both series making standard correlation statistics unreliable without detrending - The optimal Granger lag of 10 periods is suspiciously long and likely reflects shared secular trends rather than genuine predictive dynamics
5. Actionable Insights and Further Investigation
The honest actionable takeaway is do not act on this correlation as if it were causal — it is a compelling illustration of how shared time trends can produce strong r values with no mechanistic meaning. For genuine further investigation, analysts should: - Detrend both series (first-differencing or HP filter) and retest correlation on residuals, which would likely collapse toward zero - Model measles cases against vaccination rates, population immunity thresholds, and international importation events as proper causal predictors - If the goal is understanding software investment drivers, use GDP, interest rates, or tech sector employment rather than public health proxies - Apply a logarithmic transformation to X (given the right skew and Spearman Pearson signal) to better characterize the functional form if time-indexing is retained for descriptive purposes - Consider this dataset pair as a pedagogical example of Simpson's Paradox-adjacent spurious correlation for statistical literacy training
X dataset: US Measles cases and deaths historical
Y dataset: Venture Capital Investment in Software
Part of experiment: Yearly - US Measles cases and deaths historical vs Venture Capital Investment in Software