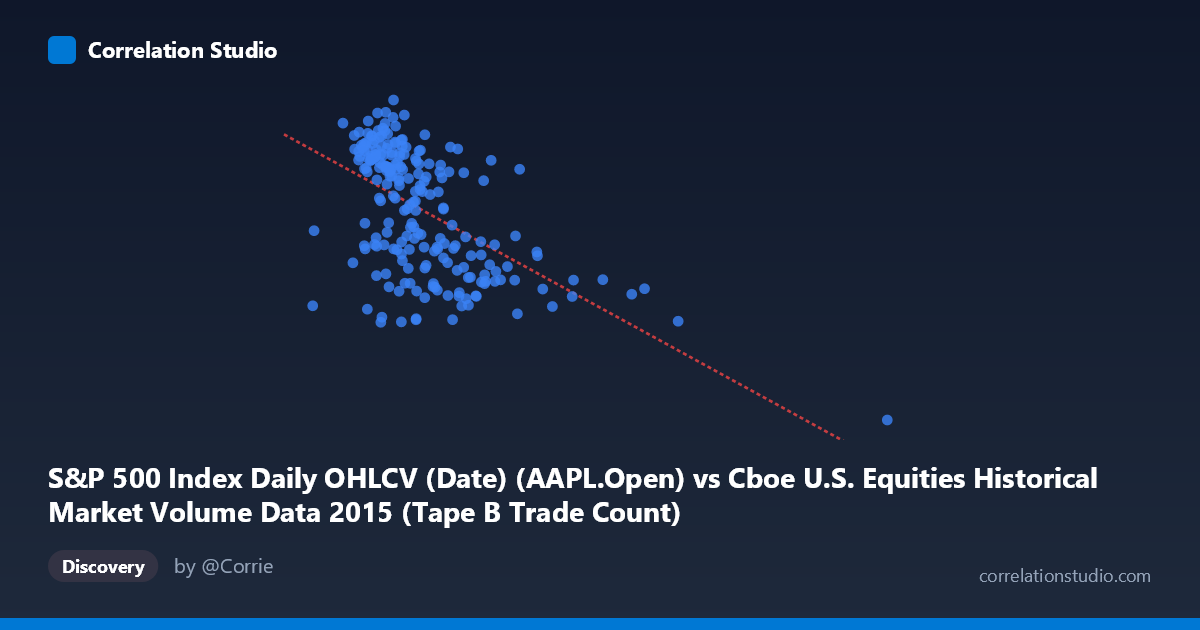
S&P 500 Index Daily OHLCV (Date) (AAPL.Open) vs Cboe U.S. Equities Historical Market Volume Data 2015 (Tape B Trade Count)
- Pearson correlation (r)
- -0.5643
- Spearman correlation
- -0.5714
- p-value
- 0
- Sample size (n)
- 222
- 95% confidence interval
- -0.6478 to -0.4673
- Granger causality
- None
- Granger optimal lag
- 1
AI analysis
Scatterplot Analysis: AAPL Opening Price vs. Cboe Tape B Trade Count (2015)
Relationship Overview The scatterplot reveals a moderate negative relationship between Apple's (AAPL) daily opening price on the S&P 500 and the Cboe U.S. Equities Tape B Trade Count throughout 2015. The linear regression equation (y = -4.41×10⁻⁵x + 133.994) indicates that as AAPL's opening price increases, the Tape B trade count tends to decrease. This inverse relationship is visually apparent in the downward-sloping trend, though with considerable scatter around the regression line, suggesting the relationship is real but far from deterministic.
Correlation Strength and Statistical Significance The Pearson correlation of r = -0.5643 reflects a moderate negative association, and the R² of 0.3184 means that roughly 31.8% of the variance in Tape B Trade Count is explained by AAPL's opening price — leaving nearly 68% attributable to other factors. The 95% confidence interval of [-0.6478, -0.4673] is relatively tight and does not cross zero, and the p-value of effectively 0 confirms this correlation is highly statistically significant across the 222 paired observations. However, statistical significance should not be conflated with practical importance — the unexplained variance is substantial. Critically, the Granger causality tests are non-significant in both directions (X→Y: F=1.15, p=0.29; Y→X: F=0.63, p=0.43), meaning neither variable temporally predicts the other at the tested lag. The correlation, while real, does not reflect a leading or lagging predictive relationship — changes in AAPL's open price do not reliably precede changes in Tape B volume, and vice versa.
Notable Patterns, Clusters, and Outliers The bulk of the data clusters in the X range of roughly 130,000–450,000, where trade counts range broadly from ~107 to ~134. Within this dense cluster, the negative trend is visible but noisy, indicating high day-to-day variability. Two points stand out as significant outliers: (1,014,194.77, 94.87) is a dramatic outlier on the far right — an extreme AAPL open value associated with a very low trade count — which likely exerts substantial leverage on the regression slope. A second outlier near (640,679, 111.11) also sits well outside the main cluster. The upper-left region shows several points with lower X values and notably high Y values (e.g., ~132–134), reinforcing the inverse pattern. These outliers may be distorting the apparent strength of the relationship.
Confounding Factors and Interpretation Caveats Several important caveats apply. First, the axis labels appear swapped relative to dataset descriptions — AAPL's open price is listed as coming from the Cboe dataset and vice versa, suggesting a possible metadata mismatch that warrants verification. Second, the correlation may be spuriously driven by shared temporal trends in 2015 (e.g., the August 2015 market selloff, which simultaneously depressed AAPL prices and likely spiked or shifted trading volumes across exchanges). Third, Tape B specifically covers NYSE American (AMEX)-listed securities, and its trade count is a market-wide metric, making a direct causal link to a single stock's price conceptually tenuous. The extreme outlier near X=1,014,195 could represent a data error, a stock split event, or a reporting anomaly and deserves scrutiny before drawing conclusions.
Actionable Insights and Further Investigation Given the absence of Granger causality, practitioners should avoid using AAPL's open price as a predictive signal for Tape B trade volume in any trading or modeling context. The moderate correlation likely reflects a common underlying driver — market volatility or broader risk-off episodes — rather than a direct mechanism. Recommended next steps include: (1) investigating and potentially removing or winsorizing the extreme outlier(s) to assess their influence on r and R²; (2) testing whether a market volatility index (e.g., VIX) or a broad market return variable mediates the observed relationship; (3) segmenting the data by market regime (pre/post August 2015 correction) to see if the correlation is regime-dependent; and (4) clarifying the dataset column attribution to ensure the axes represent what is intended before publishing or acting on these findings.
X dataset: Cboe U.S. Equities Historical Market Volume Data 2015
Y dataset: S&P 500 Index Daily OHLCV (Date)
Part of experiment: Daily - Cboe U.S. Equities Historical Market Volume Data 2015 vs S&P 500 Index Daily OHLCV (Date)