Bitcoin Historical Price Data (SplyExpFut10yr) vs CryptoDataDownload – Binance BTC/USDT Daily OHLCV (Unix)
- Pearson correlation (r)
- 0.9833
- Spearman correlation
- 1
- p-value
- 0
- Sample size (n)
- 180
- 95% confidence interval
- 0.9777 to 0.9875
- Granger causality
- None
- Granger optimal lag
- 10
- Time coverage
- 2017-08-20 to 2026-02-02
AI analysis
Analysis of Bitcoin Supply Metric Correlation
1. Overview of the Relationship
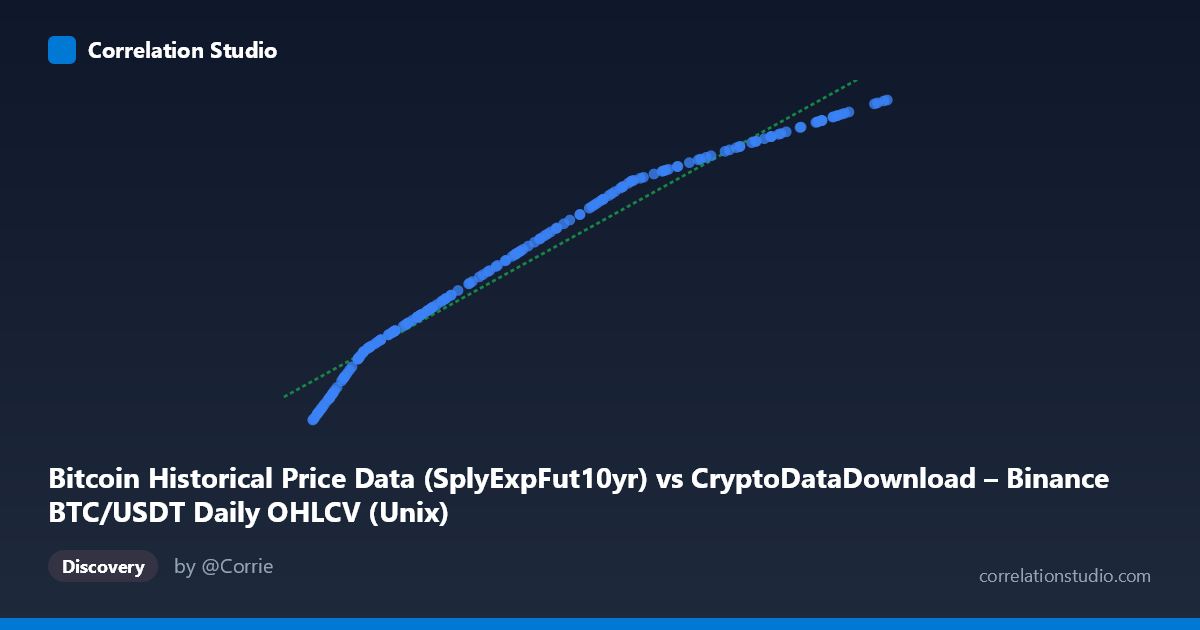
The scatterplot depicts an extremely tight, near-monotonic relationship between a time-indexed X variable (labeled as Bitcoin OHLCV data but functioning here as a timestamp/date proxy) and Y, which represents the "10-year supply expansion future" (SplyExpFut10yr) — essentially Bitcoin's projected circulating supply metric. The data traces a smooth, gently curving upward trajectory from ~20.21M (2017) to ~20.83M (2026), consistent with Bitcoin's well-known asymptotic supply issuance curve as block rewards halve approximately every four years.
2. Strength, Direction, and Statistical Confidence
The correlation is very strong and positive (r = 0.9833, R² = 0.9669), meaning the linear model explains about 96.7% of the variance in Y. The 95% CI [0.9777, 0.9875] is narrow and does not cross zero, and the p-value is effectively 0, indicating this relationship is highly statistically robust and not a product of sampling noise — unsurprising given n=180 points sampled from a monotonic, deterministic process. However, the Granger causality tests show no significant predictive direction (X→Y: p=0.097; Y→X: p=0.269) at the optimal 10-lag specification. This is an important caveat: despite the strong contemporaneous correlation, neither series helps forecast the other's future changes better than its own history. This makes sense because Y (cumulative supply) is a near-deterministic, monotonically increasing function of time/block height, not a variable causally driven by short-term BTC price/volume dynamics captured in X.
3. Notable Patterns and Non-linearities
The relationship is not perfectly linear — it exhibits a subtle S-curve/step-like concavity consistent with Bitcoin's halving schedule: supply growth rate decreases discretely every ~210,000 blocks (~4 years), producing visible "plateaus" or slope changes rather than a constant linear rate. This explains why R²=0.967 leaves ~3% unexplained: a linear fit cannot fully capture the piecewise-decelerating issuance curve. No outliers or clusters are apparent; the data is smooth and continuous, as expected for a supply schedule.
4. Caveats and Confounds
The core issue here is variable mislabeling/conflation: X is described as an OHLCV price dataset column, yet its range (1.5–1.77 trillion, matching Unix millisecond timestamps) and Y's description (supply expansion metric) suggest X is actually functioning as a time axis, not a price series. This is not a genuine "correlation between two independent market variables" — it's a mechanical relationship between time and a deterministic supply curve. Treating this as evidence of any economic or causal linkage between BTC price/volume and supply would be a category error. The Granger non-significance further confirms these aren't dynamically interacting time series in the usual sense.
5. Suggestions for Further Investigation
Given the likely mislabeling, the immediate next step is to verify column semantics and confirm X actually represents Date/Unix timestamp rather than OHLCV price. If the intent was to correlate BTC price with supply expansion (a more interesting economic question, e.g., stock-to-flow style analysis), the analysis should be rerun with the correct price column. For modeling the current Y series, a piecewise or logarithmic/step function (reflecting halving events) would fit better than a simple linear regression, and R² could likely exceed 0.99 with a proper supply-schedule model.
X dataset: CryptoDataDownload – Binance BTC/USDT Daily OHLCV
Y dataset: Bitcoin Historical Price Data
Part of experiment: Bitcoin - CryptoDataDownload – Binance BTC/USDT Daily OHLCV vs Bitcoin Historical Price Data