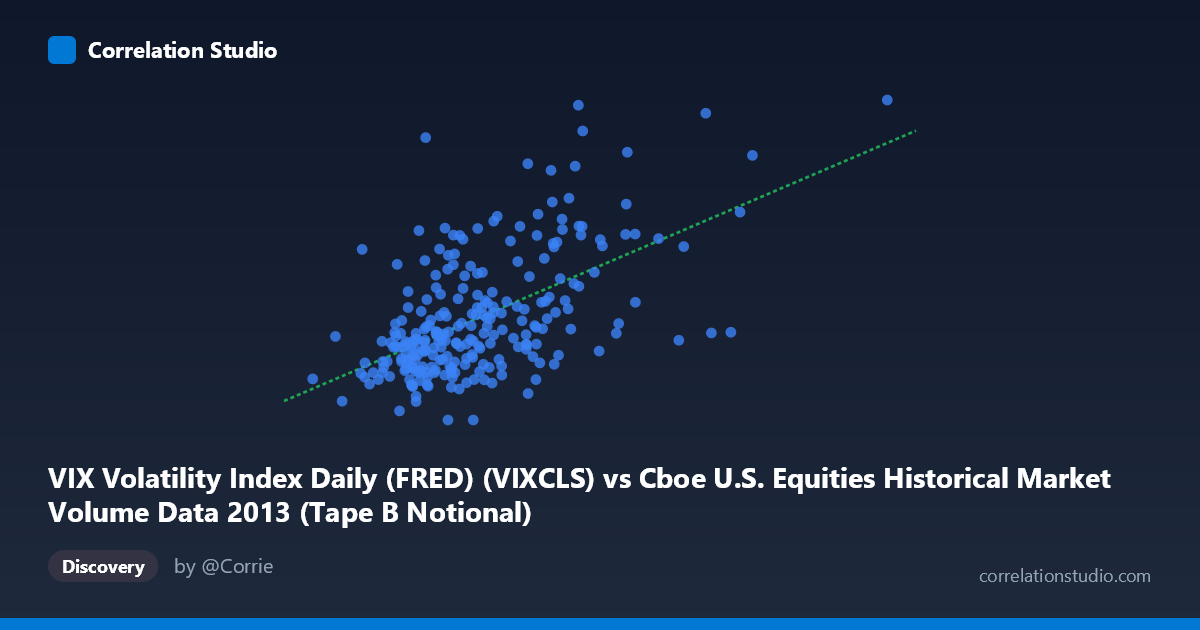
VIX Volatility Index Daily (FRED) (VIXCLS) vs Cboe U.S. Equities Historical Market Volume Data 2013 (Tape B Notional)
- Pearson correlation (r)
- 0.5669
- Spearman correlation
- 0.5245
- p-value
- 0
- Sample size (n)
- 252
- 95% confidence interval
- 0.4768 to 0.6453
- Granger causality
- None
- Granger optimal lag
- 1
AI analysis
Analysis: VIX Volatility Index vs. Cboe Tape B Notional Volume (2013)
Relationship Overview The scatterplot reveals a moderate positive relationship between the VIX Volatility Index and Cboe Tape B notional trading volume across 252 trading days in 2013. As implied volatility rises, notional trading volume on Tape B exchanges tends to increase as well. This is intuitive from a market microstructure perspective: elevated fear and uncertainty (captured by VIX) typically drives heightened trading activity as market participants reposition, hedge, or liquidate holdings. The linear regression equation (y = 9.41×10⁻¹⁰x + 10.58) confirms this positive slope, though the relationship is far from deterministic.
Correlation Strength and Statistical Significance The Pearson correlation of r = 0.5669 indicates a moderate positive association, but the coefficient of determination (r² = 0.3214) is the more sobering metric — only 32.1% of the variance in Tape B notional volume is explained by VIX levels. This means roughly 68% of volume variation is driven by factors entirely outside the VIX. The 95% confidence interval [0.4768, 0.6453] is reasonably tight and does not approach zero, lending confidence that a genuine population-level relationship exists, and the p-value of essentially 0 confirms statistical significance given n = 252 and N = 3,780. However, Granger causality tests tell a more nuanced story: neither direction (X→Y or Y→X) achieves significance at lag 1 (F = 0.63, p = 0.43 and F = 0.61, p = 0.44, respectively). This means that while VIX and Tape B volume are contemporaneously correlated, neither variable reliably predicts the other's next-period value, undermining any simple causal trading narrative.
Patterns, Clusters, and Outliers The scatterplot shows a broad central cluster concentrated in the VIX range of approximately 11–16 and volume range of roughly 12–15, reflecting 2013's characteristically low-volatility, post-crisis environment. Above a VIX of approximately 16–17, data points become more dispersed and exhibit higher volume readings, suggesting a non-linear amplification effect at elevated fear levels — the relationship may steepen in stress regimes. Several notable outliers are visible: the point near (5,187,436,082; 20.34) stands out with an extremely high VIX reading relative to its peers, and the cluster around (6,500,000,000–7,300,000,000) in the upper-right quadrant suggests specific high-volume, high-volatility episodes likely tied to identifiable macro events (e.g., the May–June 2013 "Taper Tantrum"). The lower-left cluster of low-VIX, low-volume days reinforces the regime-like nature of this data.
Confounding Factors and Caveats Several important caveats apply. First, 2013 was a structurally unusual year — VIX spent much of the year at historically suppressed levels, compressing the dynamic range and potentially inflating correlation within a narrow band. Second, Tape B notional volume reflects a specific subset of U.S. equity exchanges (NYSE American-listed securities), so this correlation may not generalize to broader market volume. Third, common drivers — such as macroeconomic announcements, Fed communications (the Taper Tantrum), earnings seasons, and end-of-quarter rebalancing — likely act as confounders that simultaneously move both VIX and volume, creating spurious or inflated correlation without a direct causal link between them. The lack of Granger causality supports this interpretation. Finally, notional value is sensitive to price levels, meaning bull market price appreciation alone can inflate notional volume independent of activity levels.
Actionable Insights and Further Investigation Practitioners should not use VIX as a standalone predictor of next-day Tape B volume given the failed Granger causality tests — the contemporaneous correlation does not translate into a forecasting edge at a one-period lag. However, the moderate correlation does suggest VIX could serve as a useful regime-classification signal: separating high-VIX (18) from low-VIX regimes and modeling volume behavior separately within each may improve fit substantially and reveal the non-linear dynamics hinted at in the scatterplot. Further investigation should include: (1) longer time horizons spanning multiple volatility cycles (2008–2023) to test whether the relationship is stable or regime-dependent; (2) multivariate regression incorporating additional predictors such as S&P 500 returns, bid-ask spreads, and options open interest; and (3) threshold or regime-switching models (e.g., Markov-switching) to formally test whether the VIX–volume relationship changes character above critical volatility thresholds. Testing at longer Granger lags (2–5 periods) may also reveal delayed predictive relationships not captured at lag 1.
X dataset: Cboe U.S. Equities Historical Market Volume Data 2013
Y dataset: VIX Volatility Index Daily (FRED)
Part of experiment: Daily - Cboe U.S. Equities Historical Market Volume Data 2013 vs VIX Volatility Index Daily (FRED)