Ethereum Historical Price Data (AssetEODCompletionTime) vs CryptoDataDownload – Binance BTC/USDT Daily OHLCV (Open)
- Pearson correlation (r)
- 0.8524
- Spearman correlation
- 0.8876
- p-value
- 0
- Sample size (n)
- 3191
- 95% confidence interval
- 0.8426 to 0.8616
- Granger causality
- None
- Granger optimal lag
- 10
AI analysis
Analysis: BTC/USDT vs. Ethereum Historical Price Data Correlation
1. What the Visualization Reveals
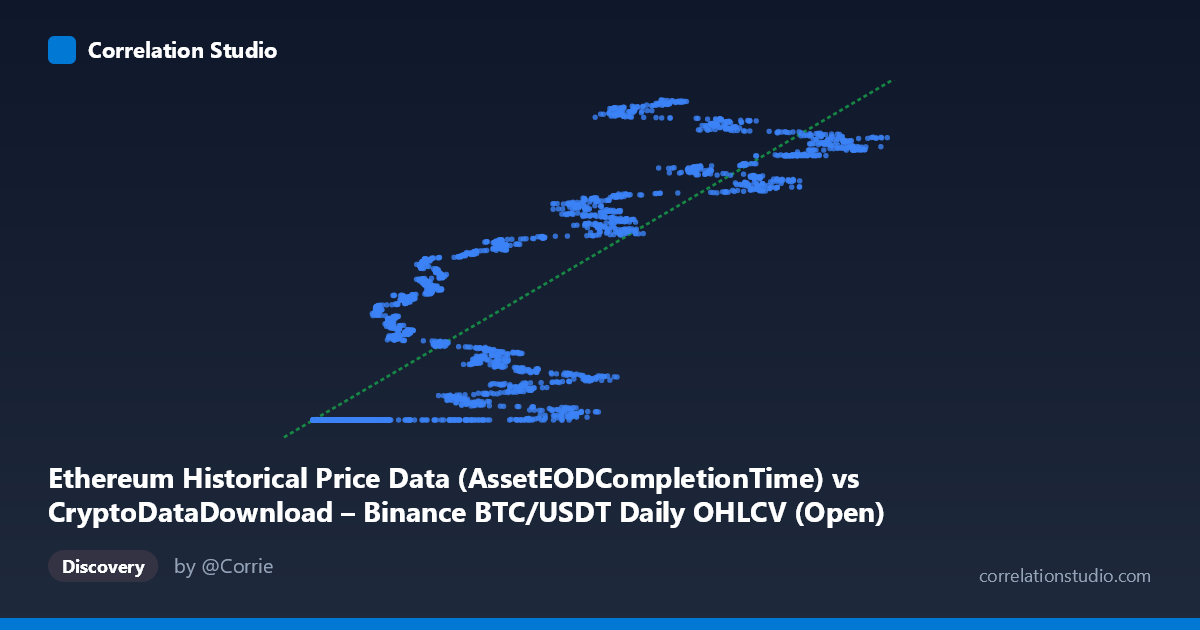
The scatterplot shows a positive, moderately strong relationship between the X variable (labeled as Ethereum Historical Price Data, though the values ~$3,188–$124,658 and pattern strongly resemble BTC price action) and the Y variable (Binance BTC/USDT Open price, ranging $1.61B–$1.78B). The data does not form a clean linear cloud—instead it reveals a distinctive two-regime structure: a dense horizontal cluster where Y is pinned near its minimum (~1,614,335,xxx) across a wide swath of X values (roughly 3,000–60,000), followed by a steeper, more scattered upward trend once X exceeds ~60,000.
2. Strength, Direction, and Uncertainty
The correlation coefficient (r = 0.8524, r² = 0.7265) indicates a strong positive linear association, with roughly 73% of the variance in Y statistically explained by X — a substantial but incomplete fit, leaving over a quarter of Y's variance unaccounted for by this linear model. The 95% confidence interval [0.8426, 0.8616] is tight, and the p-value of ~0 confirms this relationship is not due to chance at this sample size (n=3,191). However, the Granger causality tests show no significant predictive direction in either direction (X→Y: p=0.34; Y→X: p=0.15). This is a critical caveat: despite the strong contemporaneous correlation, neither series reliably forecasts the other's future movements at the tested lag (10 periods). This pattern is classic for two variables driven by a shared underlying trend or third factor rather than a direct causal linkage.
3. Notable Patterns and Outliers
The most striking feature is the flat-lined baseline: many low-X points (X < 20,000) map to nearly identical Y values (~1,614,335,200–700), suggesting these Y observations may be clipped, defaulted, or represent an early period before meaningful price discovery/variation occurred. This creates a "hockey stick" or threshold effect rather than a smooth linear relationship — likely inflating the apparent linear r² artificially in the low range while the real signal resides in the upper range (X 60,000), where Y climbs from ~1.7B to ~1.78B with more scatter and less determinism. This non-linearity means the single linear regression (y = 1432.08x + 1.61e9) is a rough approximation that underfits both regimes.
4. Confounding Factors and Caveats
Given the label mismatch (X is described as Ethereum data but the axis title says BTC/USDT; Y is described as BTC/USDT Open but tied to an "Ethereum" dataset), there's a strong possibility of metadata/column mislabeling in the source join — both series likely reflect BTC price dynamics (or a BTC-ETH relationship), which would explain the high correlation via shared crypto-market beta rather than a genuine cross-asset relationship. Additionally, since both variables are price/time-series data (2017–2026), they are subject to autocorrelation and non-stationarity — trending series produce spuriously high r² even without causal linkage. The flat baseline segment also suggests possible data quality issues (padding, missing-value imputation, or a placeholder value) in early records.
5. Actionable Insights
Before drawing conclusions, verify column/dataset labeling to confirm what X and Y actually represent — this is essential given the naming inconsistency. Next, apply stationarity transforms (e.g., log-returns or differencing) rather than raw price levels, then re-run correlation and Granger tests, since spurious correlation from shared trends is likely inflating r² here. Segment the analysis by the two visible regimes (X < 60,000 vs. X 60,000) to fit piecewise or non-linear models, and investigate the flat-Y cluster to determine if it's a legitimate data feature (e.g., early-market price stability) or an artifact requiring cleaning.
X dataset: CryptoDataDownload – Binance BTC/USDT Daily OHLCV
Y dataset: Ethereum Historical Price Data
Part of experiment: Bitcoin - CryptoDataDownload – Binance BTC/USDT Daily OHLCV vs Ethereum Historical Price Data