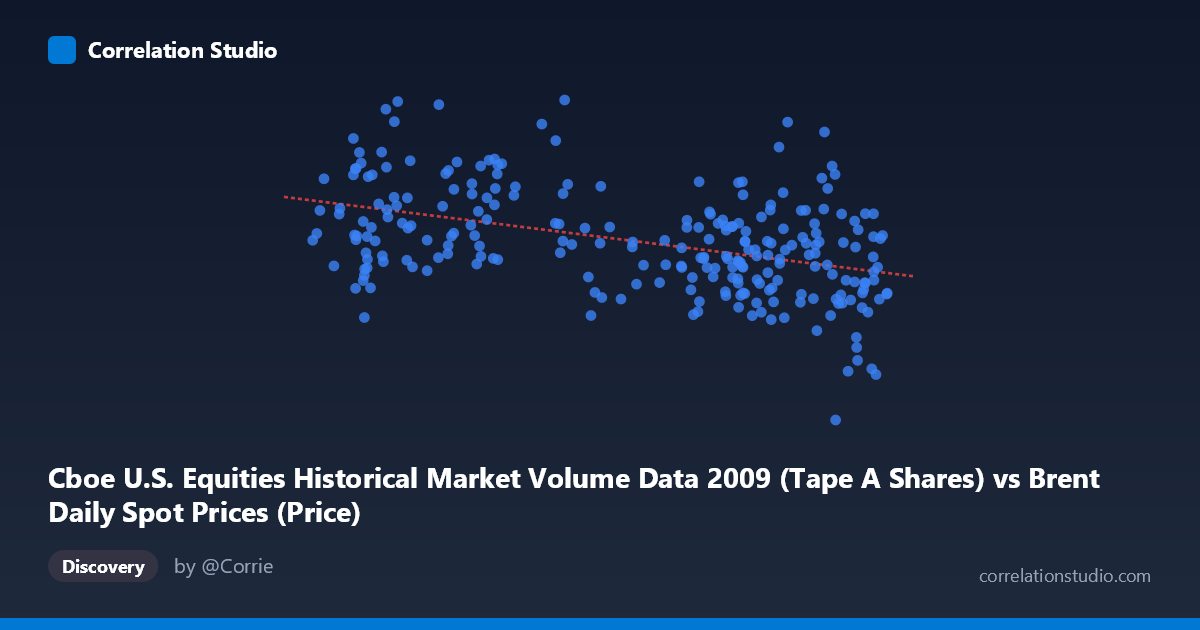
Cboe U.S. Equities Historical Market Volume Data 2009 (Tape A Shares) vs Brent Daily Spot Prices (Price)
- Pearson correlation (r)
- -0.4352
- Spearman correlation
- -0.4117
- p-value
- 0
- Sample size (n)
- 252
- 95% confidence interval
- -0.5303 to -0.3294
- Granger causality
- None
- Granger optimal lag
- 10
AI analysis
Scatterplot Analysis: Brent Crude Oil Prices vs. Cboe U.S. Equity Market Volume (2009)
Relationship Overview
The scatterplot reveals a modest negative relationship between Brent crude oil spot prices (X-axis, measured in USD/barrel) and Cboe U.S. equity market volume (Y-axis, measured in shares traded). The linear regression equation y = -3,450,900x + 652,187,000 suggests that for every $1 increase in oil price, equity trading volume declines by approximately 3.45 million shares. Visually, while the downward trend is present, the data points are widely dispersed around the regression line, signaling that this relationship is far from deterministic and considerable noise exists throughout the range.
Correlation Strength and Statistical Significance
The correlation coefficient of r = -0.4352 indicates a weak-to-moderate negative association. More meaningfully, r² = 0.1894 means that only ~19% of the variance in equity trading volume is explained by oil price levels — leaving roughly 81% of variation attributable to other factors entirely. The 95% confidence interval of [-0.5303, -0.3294] is reasonably narrow and does not cross zero, and the p-value of 4.53 × 10⁻¹³ confirms the correlation is highly statistically significant, largely a function of the large sample size (N = 3,232; n = 252). Crucially, however, the Granger causality tests show no significant predictive directionality in either direction (X→Y: F = 0.96, p = 0.478; Y→X: F = 1.77, p = 0.067). This means that despite the statistically significant correlation, neither variable reliably predicts the future values of the other — a critical distinction between association and temporal forecasting utility.
Notable Patterns, Clusters, and Outliers
Several features stand out in the data. The X range spans roughly $39–$79/barrel, which captures Brent's significant recovery trajectory during 2009 following its late-2008 collapse. The high-volume cluster (above ~580M shares) appears disproportionately concentrated at lower oil price levels (roughly $42–$58/barrel), consistent with the early-2009 period of market stress and heightened volatility driving heavy trading activity. Conversely, as oil prices recovered toward $70–$78/barrel in the second half of 2009, volume observations become more moderate, though with substantial scatter. Several notable outliers are visible: the point near (56.63, 704M) represents an exceptionally high-volume day, and (75.15, 105.7M) represents an anomalously low-volume day despite mid-range oil prices — both warrant individual investigation. A non-linear pattern may also be present, with higher variance in volume at lower oil price levels, suggesting heteroscedasticity.
Confounding Factors and Caveats
Interpreting this correlation requires significant caution. Both variables are time-indexed across 2009, meaning the observed negative correlation may largely reflect a shared temporal trend rather than a direct economic link — equity volumes were generally elevated in early 2009 during peak crisis volatility, while oil prices were simultaneously depressed, and as the year progressed, oil recovered while volumes normalized. This creates a classic spurious correlation driven by a common third factor (the global financial crisis recovery arc). Additionally, equity market volume is influenced by a vast array of factors — VIX-driven volatility, institutional rebalancing, earnings seasons, and Federal Reserve interventions — that are entirely orthogonal to oil prices. The dataset mismatch (Cboe volume data used as X, Brent prices as Y, and vice versa in labeling) also suggests care is needed in interpreting variable assignments.
Actionable Insights and Further Investigation
Given that the relationship explains only ~19% of variance and shows no Granger causality, practitioners should not use oil prices as a standalone predictor of equity volume. Further investigation should include: (1) controlling for time trends by detrending or differencing both series to isolate contemporaneous relationships from shared temporal drift; (2) testing whether the relationship is regime-dependent, specifically whether it strengthens during high-volatility or crisis periods; (3) incorporating VIX or credit spread data as mediating variables that may explain both elevated volumes and depressed oil prices simultaneously; and (4) examining non-linear model fits (e.g., piecewise or polynomial regression) given the apparent heteroscedasticity. The near-significant Y→X Granger result (p = 0.067) also hints that high equity volume may have weak leading information for oil prices at a 10-period lag, worth exploring with a larger dataset or refined lag structure.
X dataset: Brent Daily Spot Prices
Y dataset: Cboe U.S. Equities Historical Market Volume Data 2009
Part of experiment: Daily - Brent Daily Spot Prices vs Cboe U.S. Equities Historical Market Volume Data 2009