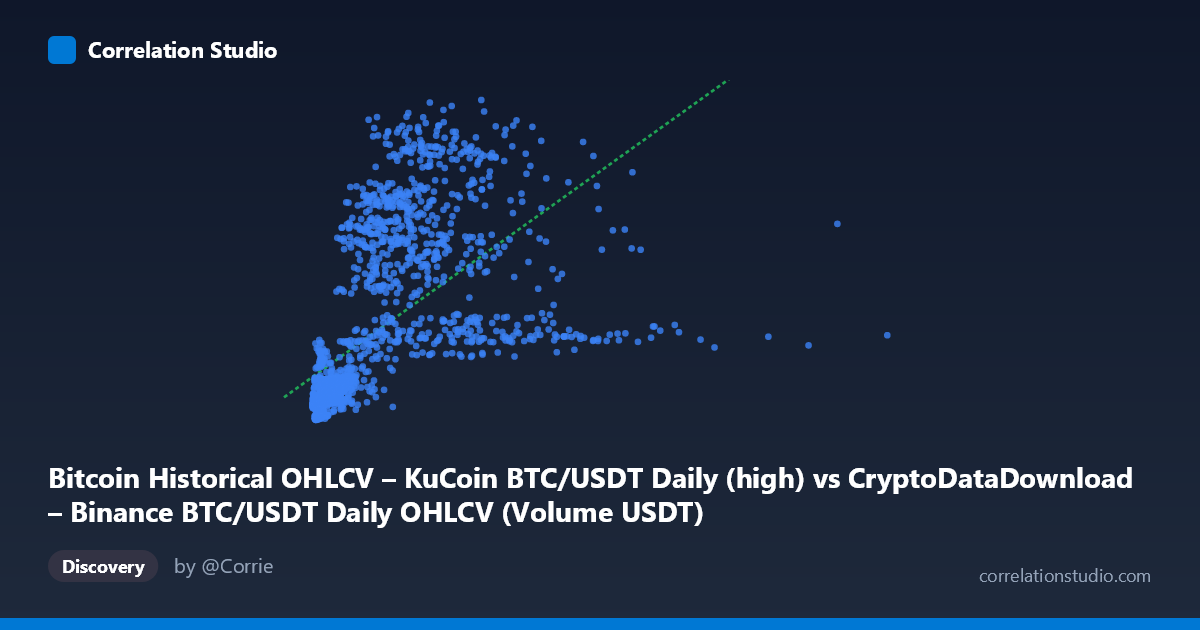
Bitcoin Historical OHLCV – KuCoin BTC/USDT Daily (high) vs CryptoDataDownload – Binance BTC/USDT Daily OHLCV (Volume USDT)
- Pearson correlation (r)
- 0.5913
- Spearman correlation
- 0.8347
- p-value
- 0
- Sample size (n)
- 1861
- 95% confidence interval
- 0.561 to 0.6201
- Granger causality
- None
- Granger optimal lag
- 10
- Time coverage
- 2017-10-19 to 2022-11-29
AI analysis
Analysis: BTC/USDT Price (High) vs. Trading Volume (USDT)
1. What the Visualization Reveals
The scatterplot illustrates the relationship between Bitcoin's daily high price and its corresponding trading volume (denominated in USDT) across a ~5-year window (Oct 2017–Nov 2022). The data shows a positive association: as BTC's price level rises, volume in USDT terms also tends to rise. This is intuitive since volume is measured in USDT (dollar-equivalent terms) rather than BTC units — at higher prices, the same number of BTC traded translates into a larger USDT-denominated volume figure, creating a partially mechanical relationship rather than purely an independent economic signal.
2. Strength, Direction, and Statistical Confidence
The Pearson correlation (r = 0.591) indicates a moderate positive relationship, with r² = 0.350 meaning only 35% of the variance in volume is explained by price — the majority (65%) is driven by other factors (market volatility, news events, liquidity cycles, etc.). The 95% CI [0.561, 0.620] is tight and does not cross zero, and the p-value of ~0 confirms this correlation is highly statistically significant and not due to chance, given the large sample (n=1,861 daily observations).
However, the Granger causality tests reveal no significant predictive direction in either direction (X→Y: p=0.221; Y→X: p=0.778) at the optimal 10-lag structure. This is an important nuance: despite the contemporaneous correlation, past price levels do not reliably forecast future volume, nor does past volume forecast future price. This suggests the relationship is either simultaneous/contemporaneous (both driven by the same underlying market conditions) or too noisy/nonlinear for a linear Granger framework to detect a lead-lag structure.
3. Notable Patterns and Non-linearity
The note that Spearman ρ exceeds Pearson r is a strong signal that a non-linear (monotonic) relationship fits better than the linear model. Visually and from the sample points, this likely reflects: - Heteroscedastic fan-shaping: volume dispersion increases substantially at higher price levels (e.g., prices $3B "high" show volumes ranging widely from ~20,000 to ~60,000, while low-price clusters near $100–300M show tighter volume ranges of 3,000–10,000). - Diminishing marginal volume growth: some evidence of the relationship flattening or exhibiting logarithmic/power-law behavior at extreme price ranges — consistent with volume saturating relative to price during parabolic price runs. - Distinct clustering by market regime: a cluster of low-price/low-volume points (~2018 bear market) and a cluster of high-price/high-volume points (2020–2021 bull run), with a sparser bridge between them, is typical of crypto's regime-switching dynamics.
4. Confounding Factors and Caveats
Several caveats limit causal interpretation: - Same-day/near-contemporaneous variables: Both series essentially derive from the same underlying market activity (price and volume are jointly determined each trading day), making causal inference (in the economic sense) inappropriate — correlation here reflects co-movement, not one variable driving the other. - Denomination effect: Because volume is in USDT, higher BTC prices mechanically inflate the USDT-volume figure even if the number of BTC traded is flat — a scaling artifact rather than a real behavioral relationship. - Cross-exchange data: X is sourced from Binance while Y is sourced from KuCoin — differing liquidity, user bases, and fee structures between exchanges could introduce noise or structural breaks unrelated to genuine BTC price-volume dynamics. - Non-stationarity: Both series exhibit trends and volatility clustering (typical of crypto), which can inflate correlation estimates and invalidate the assumptions underlying Granger causality testing (differencing/log-transformation is typically needed).
5. Suggestions for Further Investigation
- Re-run regression using log-transformed variables (log-price vs. log-volume) or a polynomial fit, given the Spearman-Pearson gap suggesting non-linearity. - Difference or detrend the series (e.g., % daily returns for price, % change in volume) before Granger testing, since raw price/volume levels are non-stationary and can produce spurious or misleading causality results. - Segment by market regime (bull vs. bear markets) to check if the price-volume relationship is regime-dependent rather than stable across the full sample. - Normalize volume by price (i.e., convert to BTC-denominated volume) to isolate genuine trading-activity relationships from the mechanical USDT-scaling effect. - Incorporate volatility as a third variable, since both price and volume are often jointly driven by volatility spikes (news, macro events), which may better explain the unexplained 65% of variance.
X dataset: CryptoDataDownload – Binance BTC/USDT Daily OHLCV
Y dataset: Bitcoin Historical OHLCV – KuCoin BTC/USDT Daily
Part of experiment: Bitcoin - CryptoDataDownload – Binance BTC/USDT Daily OHLCV vs Bitcoin Historical OHLCV – KuCoin BTC/USDT Daily