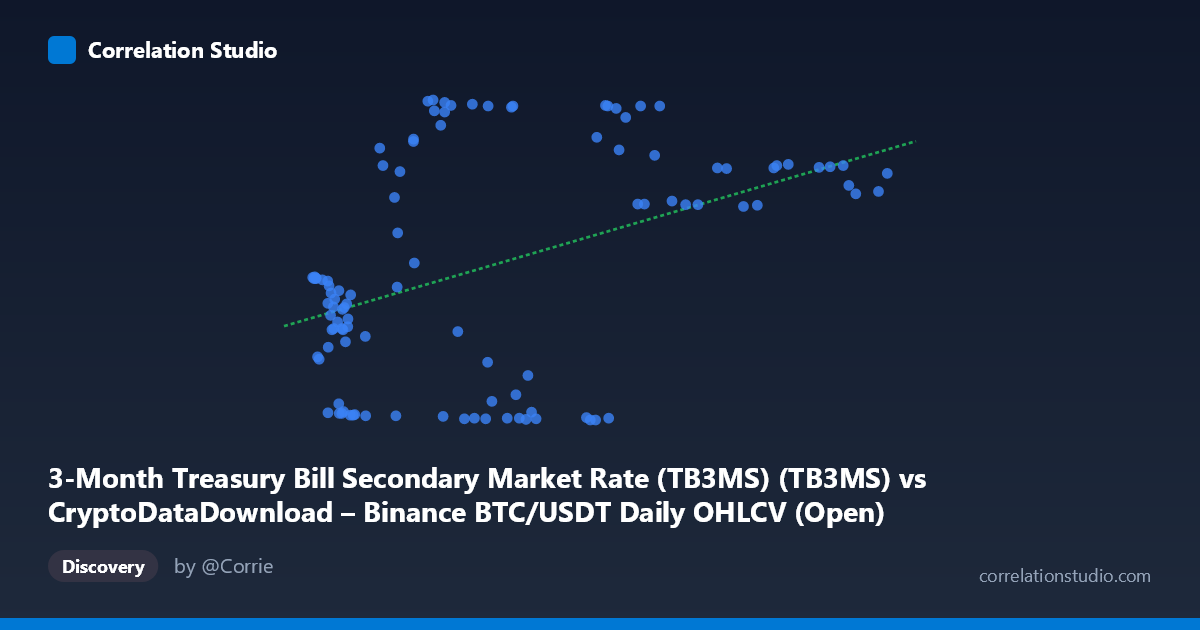
3-Month Treasury Bill Secondary Market Rate (TB3MS) (TB3MS) vs CryptoDataDownload – Binance BTC/USDT Daily OHLCV (Open)
- Pearson correlation (r)
- 0.4283
- Spearman correlation
- 0.3303
- p-value
- 0.000005
- Sample size (n)
- 106
- 95% confidence interval
- 0.2587 to 0.5723
- Granger causality
- Y → X
- Granger optimal lag
- 1
AI analysis
Analysis: BTC/USDT Price vs. 3-Month Treasury Bill Rate
1. Overall Relationship
The scatterplot shows a weak-to-moderate positive association between the 3-Month Treasury Bill rate (X-axis) and BTC/USDT opening price (Y-axis). Rather than a clean linear trend, the data reveals a fragmented, cluster-like structure: at low X-values (roughly 4,000–20,000), Y-values are scattered widely (from ~0.1 to ~2.4), while at higher X-values (above ~40,000), Y-values cluster tightly in a high band (4.0–5.3) with a few notable dips (e.g., 46,216 → 0.15; 47,100 → 0.04). This suggests the relationship is not a simple continuous function but may reflect distinct regime shifts in the underlying rate environment.
2. Strength, Direction, and Statistical Confidence
The correlation coefficient (r = 0.425) indicates a modest positive relationship, and r² = 0.181 tells us that only about 18% of the variance in the T-bill rate is explained by BTC price (or vice versa) — leaving over 80% of variability driven by other factors. The 95% CI [0.254, 0.571] is reasonably tight and entirely positive, and the p-value (6.1E-06) confirms this correlation is statistically significant and not due to chance. However, statistical significance with a large sample (n=105) doesn't imply strong predictive power — the relationship is real but weak in practical terms. Critically, the Granger causality tests show no significant predictive direction: X→Y is clearly non-significant (p=0.615), and Y→X is only marginally suggestive (p=0.074, below conventional significance). This means neither variable reliably "leads" the other in time — the correlation is likely coincidental co-movement (e.g., both trending upward over the 2017–2026 window) rather than a causal or forecastable relationship.
3. Notable Patterns and Outliers
Several features stand out: - Low-X, low-Y outliers: Points like (46,216, 0.15), (47,100, 0.04), (45,134, 0.03), and (28,923, 0.08) sit far below the general trend for their X-range, suggesting periods where BTC price was elevated but rates were near-zero (likely the 2020–2021 near-zero rate era). - High-X clustering: Above X≈60,000, Y values consistently sit in the 3.5–5.3 range, suggesting a "high-rate regime" (2022–2023 Fed tightening cycle) coinciding with elevated BTC prices — though this could simply reflect that both series trended upward over the sample period rather than genuine linkage. - Bimodal appearance: The data almost splits into two clouds — a low-rate/mixed-price cluster and a high-rate/high-price cluster — rather than a smooth continuum, which weakens the case for a true linear relationship despite the significant r².
4. Confounding Factors and Caveats
The most important caveat: this pairing conflates a daily cryptocurrency price series with a monthly macroeconomic rate, and both are analyzed over a long span (2017–2026) marked by major regime changes (COVID-19 near-zero rates, 2022–2023 aggressive Fed hikes, BTC bull/bear cycles). This is a classic setup for spurious correlation via shared time trend — both series may be non-stationary and trending together over time without any genuine economic linkage. Other confounders include macro liquidity conditions, risk-on/risk-off sentiment, inflation expectations, and regulatory news — all of which independently affect BTC prices and could indirectly correlate with rate cycles. The low r² despite significant p-value is a signature of exactly this kind of weak, trend-driven association.
5. Suggested Next Steps
To determine if this relationship is meaningful rather than spurious, analysts should: (1) difference or detrend both series (e.g., use rate changes and BTC returns rather than levels) and re-test correlation/Granger causality; (2) test for cointegration given both series appear non-stationary; (3) segment the analysis by distinct monetary policy regimes (zero-rate vs. hiking cycles) to see if the relationship holds within-regime or is purely an artifact of regime-level co-trending; and (4) incorporate additional macro variables (DXY, real yields, equity risk premiums) to control for common drivers. Given the current evidence, this correlation should not be used for trading signals or forecasting without further robustness checks.
X dataset: CryptoDataDownload – Binance BTC/USDT Daily OHLCV
Y dataset: 3-Month Treasury Bill Secondary Market Rate (TB3MS)
Part of experiment: Bitcoin - CryptoDataDownload – Binance BTC/USDT Daily OHLCV vs 3-Month Treasury Bill Secondary Market Rate (TB3MS)