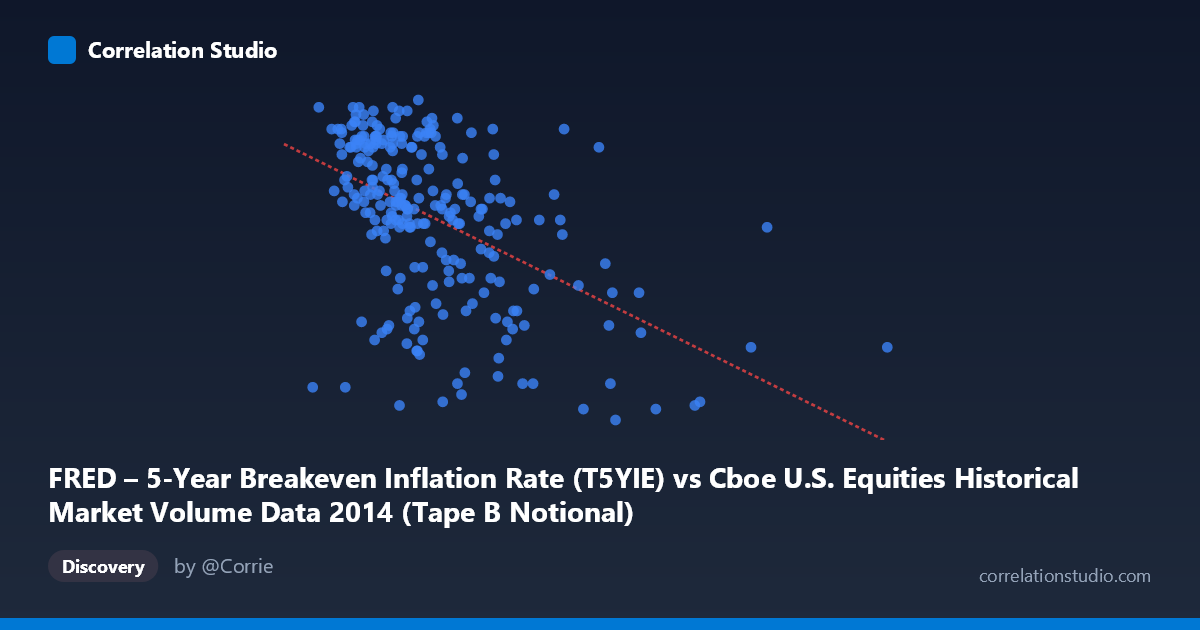
FRED – 5-Year Breakeven Inflation Rate (T5YIE) vs Cboe U.S. Equities Historical Market Volume Data 2014 (Tape B Notional)
- Pearson correlation (r)
- -0.5024
- Spearman correlation
- -0.5084
- p-value
- 0
- Sample size (n)
- 250
- 95% confidence interval
- -0.5897 to -0.4035
- Granger causality
- None
- Granger optimal lag
- 1
AI analysis
Analysis: 5-Year Breakeven Inflation Rate vs. Cboe U.S. Equities Market Volume (2014)
Relationship Overview The scatterplot reveals a moderate negative relationship between U.S. equity market trading volume (notional value) and the 5-year breakeven inflation rate throughout 2014. As trading volume increases, breakeven inflation expectations tend to decline. The linear regression equation (y = -7.15×10⁻¹¹x + 2.04) confirms this inverse slope, suggesting that days with exceptionally high equity market activity coincide with lower forward-looking inflation expectations. This pattern is visually apparent in the data, with lower-volume observations clustering around higher inflation readings (1.75–2.05) and higher-volume days pulling toward the lower end of the inflation range (1.17–1.60).
Correlation Strength and Statistical Significance The Pearson correlation of r = -0.50 indicates a moderate negative association, but the explanatory power is more modest than the headline figure suggests: r² = 0.2524, meaning only about 25% of the variance in the breakeven inflation rate is statistically explained by trading volume. The remaining 75% is attributable to other factors entirely. The 95% confidence interval of [-0.59, -0.40] is meaningfully away from zero and reasonably tight given the sample size of 250, and the p-value of effectively 0 confirms this is not a chance finding across the N=3,686 population. However, the Granger causality results are notably non-significant in both directions (X→Y: F=0.07, p=0.79; Y→X: F=0.79, p=0.37), meaning neither variable temporally predicts the other with a one-period lag. This is a critical caveat: despite a statistically robust contemporaneous correlation, there is no evidence of a predictive or directional temporal relationship — the two variables move together but neither reliably leads the other.
Notable Patterns, Clusters, and Outliers The data exhibits a visible right-skewed distribution along the X-axis, with the bulk of observations concentrated below ~6 billion in notional volume and a sparse but influential tail extending to ~13 billion (notably, the maximum value of 13,008,696,235 at a breakeven rate of 1.37 stands as a clear outlier). There appear to be two loosely defined clusters: a dense grouping of moderate-volume days (roughly 2.5–5.5 billion) spanning the full inflation range, and a sparser high-volume cluster (6–13 billion) almost exclusively associated with lower inflation readings below 1.65. The spread within the moderate-volume cluster is substantial, suggesting that volume alone is a weak predictor at typical trading levels, with its explanatory value driven disproportionately by extreme volume events.
Confounding Factors and Interpretive Caveats Several confounding dynamics complicate a direct causal reading of this correlation. First, both variables are likely jointly driven by macroeconomic risk events — market stress episodes in 2014 (e.g., geopolitical tensions, Fed tapering concerns) could simultaneously spike trading volume and depress inflation expectations, creating a spurious-looking correlation. Second, the axes appear swapped from intuitive convention: the X-axis carries the inflation rate data and the Y-axis carries the volume data based on dataset labeling, which warrants careful verification before drawing conclusions. Third, temporal autocorrelation in both daily financial series means the effective degrees of freedom are likely lower than the raw n=250 implies, potentially overstating statistical confidence. Finally, the 2014 timeframe is a specific macro regime (post-QE tapering, low volatility transitioning to late-year turbulence) that may not generalize.
Actionable Insights and Further Investigation Analysts should decompose high-volume trading days to determine whether volume spikes are driven by specific event types (e.g., Fed announcements, equity sell-offs, options expiration) and whether those events have independent effects on breakeven rates. A multivariate regression incorporating VIX, 10-year Treasury yields, and equity index returns would help isolate whether volume carries any marginal explanatory power beyond broader risk-off sentiment. Given the lack of Granger causality, volume-based trading signals for inflation forecasting appear unwarranted, but the contemporaneous relationship could inform intraday or event-driven hedging strategies linking TIPS-derived inflation products with equity market activity. Extending the dataset beyond 2014 would test whether this moderate correlation is a stable structural feature or an artifact of a specific macro environment.
X dataset: Cboe U.S. Equities Historical Market Volume Data 2014
Y dataset: FRED – 5-Year Breakeven Inflation Rate
Part of experiment: Daily - Cboe U.S. Equities Historical Market Volume Data 2014 vs FRED – 5-Year Breakeven Inflation Rate