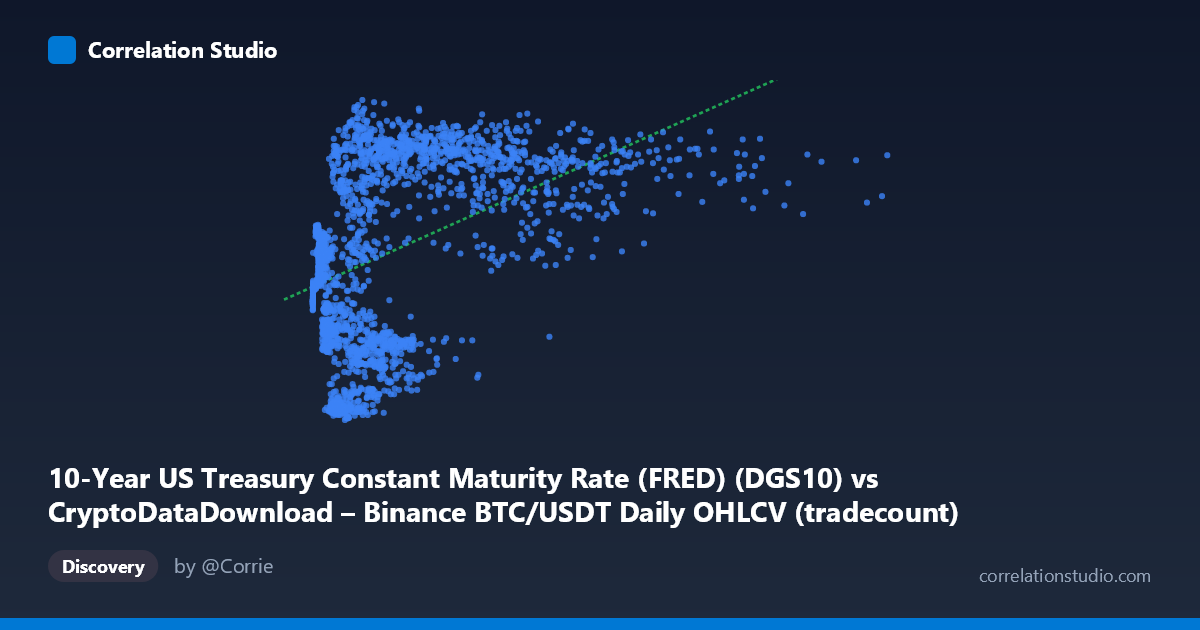
10-Year US Treasury Constant Maturity Rate (FRED) (DGS10) vs CryptoDataDownload – Binance BTC/USDT Daily OHLCV (tradecount)
- Pearson correlation (r)
- 0.4544
- Spearman correlation
- 0.4582
- p-value
- 0
- Sample size (n)
- 2197
- 95% confidence interval
- 0.4206 to 0.487
- Granger causality
- None
- Granger optimal lag
- 1
- Time coverage
- 2017-08-17 to 2026-06-25
- Recomputed on refreshed data
- 2026-10-22 (r was 0.4544)
AI analysis
Analysis: BTC/USDT Trading Metrics vs. 10-Year Treasury Rate
Note on axis labeling: There appears to be a metadata mismatch in this dataset — the X-axis is labeled as the 10-Year Treasury rate but shows values in the millions (3,070 to 15,364,010), which is clearly BTC trading volume or tradecount, not a yield. Conversely, the Y-axis (0.52–4.98) is consistent with a Treasury yield range over the 2017-2026 period. The analysis below treats X as a BTC/USDT trading activity metric (likely tradecount or volume) and Y as the 10-Year Treasury yield, per the actual data distributions.
1. Relationship Overview The scatterplot shows a positive, moderate-strength association: as BTC trading activity increases, the corresponding Treasury yield tends to be higher as well. The relationship is not tightly linear — points are widely scattered around the regression line (y = 2.31×10⁻⁷x + 2.373), indicating substantial dispersion at every level of X.
2. Correlation Strength & Statistical Confidence With r = 0.452 and r² = 0.204, only about 20% of the variance in the Treasury yield is statistically associated with variance in BTC trading activity — meaning 80% of the variation is driven by other factors not captured in this bivariate relationship. The correlation is statistically significant (p ≈ 0, CI [0.418, 0.485]), so we can be confident the true population correlation is positive and moderate — but statistical significance here reflects large sample size (n=2,183) more than practical predictive strength. Critically, the Granger causality tests show no significant predictive direction in either direction (X→Y: p=0.59; Y→X: p=0.57). This means neither variable helps forecast future values of the other over a 1-day lag — the correlation is likely coincidental co-movement (e.g., both trending upward over 2017–2026) rather than a causal or lead-lag dynamic.
3. Notable Patterns - Clustering at low X values: The vast majority of sample points cluster below X≈2,000,000, with Y values spanning almost the entire 0.5–4.5 range — indicating high variance in yield at low trading activity, weakening the linear fit in this dense region. - Sparse high-X tail: Points beyond X≈5,000,000 are sparse but show consistently higher Y values (3.5–4.7), which likely pulls the regression slope upward and may be disproportionately influential (leverage points). - Non-linear suggestion: The pattern looks more like two regimes — a noisy, flat cluster at low X and a smaller elevated cluster at high X — rather than a smooth linear trend, suggesting a threshold or regime-shift effect rather than continuous correlation.
4. Confounding Factors & Caveats - Spurious correlation via shared trend: Both series may simply trend upward over the 2017–2026 window (Treasury yields rose sharply post-2021; BTC activity also grew), producing correlation without any mechanistic link — the hallmark of non-stationary time series correlation. - Metric mismatch: The labeling inconsistency (X described as a rate but behaving as a volume/count) raises data-quality concerns that should be resolved before drawing conclusions. - Lack of lag/lead structure: The null Granger result reinforces that this is likely a spurious or third-factor-driven relationship (e.g., macro liquidity conditions, calendar time) rather than one variable influencing the other.
5. Recommendations for Further Investigation - Detrend or difference both series (e.g., use daily returns/changes rather than levels) and re-test correlation and Granger causality to control for shared time trends. - Verify and correct axis/column labeling in the source data pipeline before further modeling. - Test longer lags (weekly, monthly) for Granger causality, since 1-day lag may be too short to capture macro-driven effects. - Segment by regime (e.g., pre/post-2021 rate hikes) to check if the relationship is stable or driven by a specific sub-period.
X dataset: CryptoDataDownload – Binance BTC/USDT Daily OHLCV
Y dataset: 10-Year US Treasury Constant Maturity Rate (FRED)
Part of experiment: Bitcoin - CryptoDataDownload – Binance BTC/USDT Daily OHLCV vs 10-Year US Treasury Constant Maturity Rate (FRED)