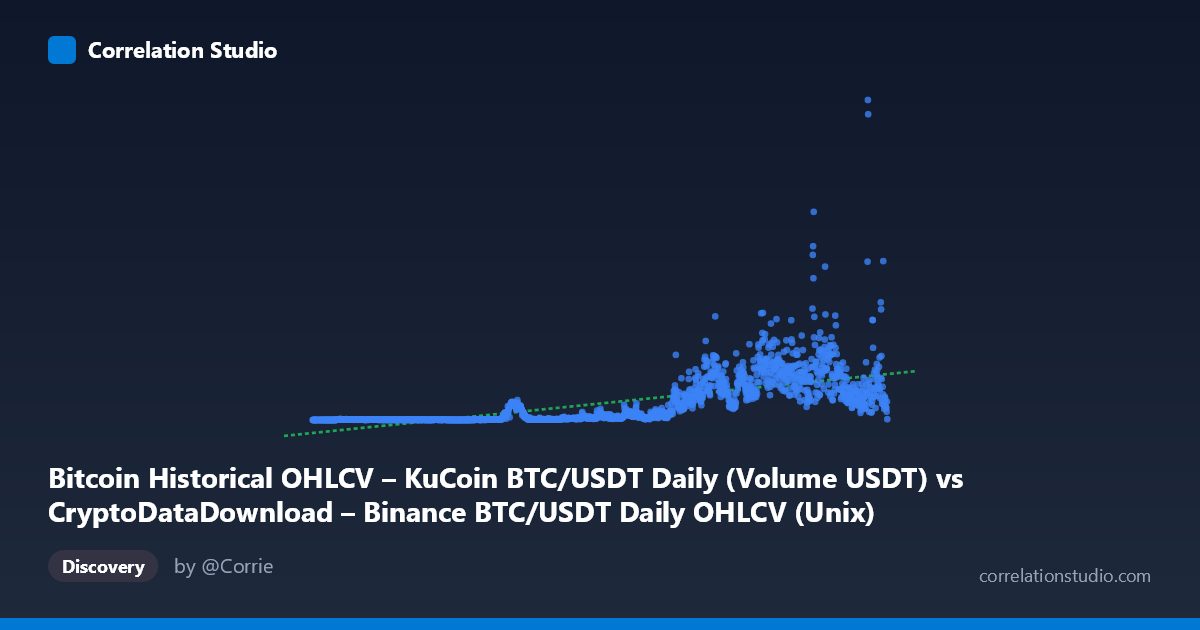
Bitcoin Historical OHLCV – KuCoin BTC/USDT Daily (Volume USDT) vs CryptoDataDownload – Binance BTC/USDT Daily OHLCV (Unix)
- Pearson correlation (r)
- 0.6656
- Spearman correlation
- 0.8937
- p-value
- 0
- Sample size (n)
- 1861
- 95% confidence interval
- 0.6395 to 0.6901
- Granger causality
- None
- Granger optimal lag
- 10
- Time coverage
- 2017-10-19 to 2022-11-29
AI analysis
Analysis: Time (X) vs Trading Volume (Y)
1. What the Visualization Reveals
This scatterplot plots a timestamp variable (X, essentially "date" encoded as Unix milliseconds) against Bitcoin/USDT trading volume (Y) spanning October 2017 to November 2022. The relationship is fundamentally a time-series growth pattern rather than a conventional bivariate correlation between two independent measurements — X is functioning as a proxy for "time elapsed," and Y shows how trading volume evolved over that period. The scatter shows volume start near-zero (hundreds to thousands of USDT in 2017-2018) and expand dramatically into the hundreds of millions and occasionally over a billion USDT by 2021-2022, consistent with the broader maturation and institutionalization of crypto markets.
2. Strength, Direction, and Statistical Confidence
The Pearson correlation (r = 0.666, r² = 0.443) indicates a moderate-to-strong positive relationship, but the coefficient of determination tells the more important story: only 44.3% of the variance in trading volume is explained by the linear time trend. The remaining 55.7% is driven by other factors — market volatility, news events, bull/bear cycles, etc. The 95% CI [0.640, 0.690] is tight given the large sample (n=1,861 daily observations), and the p-value of ~0 confirms the trend is not due to chance. However, Granger causality tests show no significant predictive relationship in either direction (X→Y: p=0.257; Y→X: p=0.637). This is expected and somewhat tautological here — time cannot be "predicted" by volume, and the test mainly confirms that lagged volume values don't mechanically forecast the calendar date. This causality result should be interpreted cautiously since X is a time index, not a substantive independent variable.
3. Notable Patterns and Non-linearities
The data is strongly non-linear and heteroscedastic — variance in Y increases dramatically as X (time) increases, a classic volume/volatility clustering pattern. Early data (2017-2019) is compressed near zero with very low variance, while 2020-2022 shows explosive spread, including a visible outlier/spike around May 2022 (~1.24 billion USDT) likely tied to the Terra/LUNA collapse and associated market turmoil. The note that Spearman ρ exceeds Pearson r strongly suggests the true relationship is monotonic but curved — likely exponential or logarithmic growth — rather than linear. A log-transformation of Y (common for volume/financial data) would likely reveal a much cleaner, higher-r linear fit and reduce heteroscedasticity.
4. Confounding Factors and Caveats
Several caveats apply: (1) Autocorrelation — daily volume is highly autocorrelated with itself, violating independence assumptions of Pearson correlation and inflating apparent significance. (2) Non-stationarity — both the trend and variance in Y change over time, making a single linear r a poor summary. (3) External shocks — COVID-19 (2020), the 2021 bull run, and the 2022 LUNA/FTX-adjacent crashes are structural breaks, not steady trend components, and likely account for much of the unexplained variance. (4) Using calendar time as "X" means the correlation is essentially describing overall market growth/adoption rather than a causal driver.
5. Recommendations for Further Investigation
- Log-transform Y (and consider log or rank-transforming X) and refit — likely to substantially increase R² and better reflect the exponential growth pattern. - Segment analysis by year or market regime (bull/bear/crash) rather than treating 2017-2022 as one homogeneous trend. - Detrend and analyze residuals to identify volume anomalies tied to specific events (halving, regulatory news, exchange collapses). - Since X is just time, a more informative analysis would replace it with a genuine explanatory variable (e.g., price volatility, social sentiment, on-chain activity) to test real causal/predictive relationships, rather than relying on Granger causality against a calendar index.
X dataset: CryptoDataDownload – Binance BTC/USDT Daily OHLCV
Y dataset: Bitcoin Historical OHLCV – KuCoin BTC/USDT Daily
Part of experiment: Bitcoin - CryptoDataDownload – Binance BTC/USDT Daily OHLCV vs Bitcoin Historical OHLCV – KuCoin BTC/USDT Daily