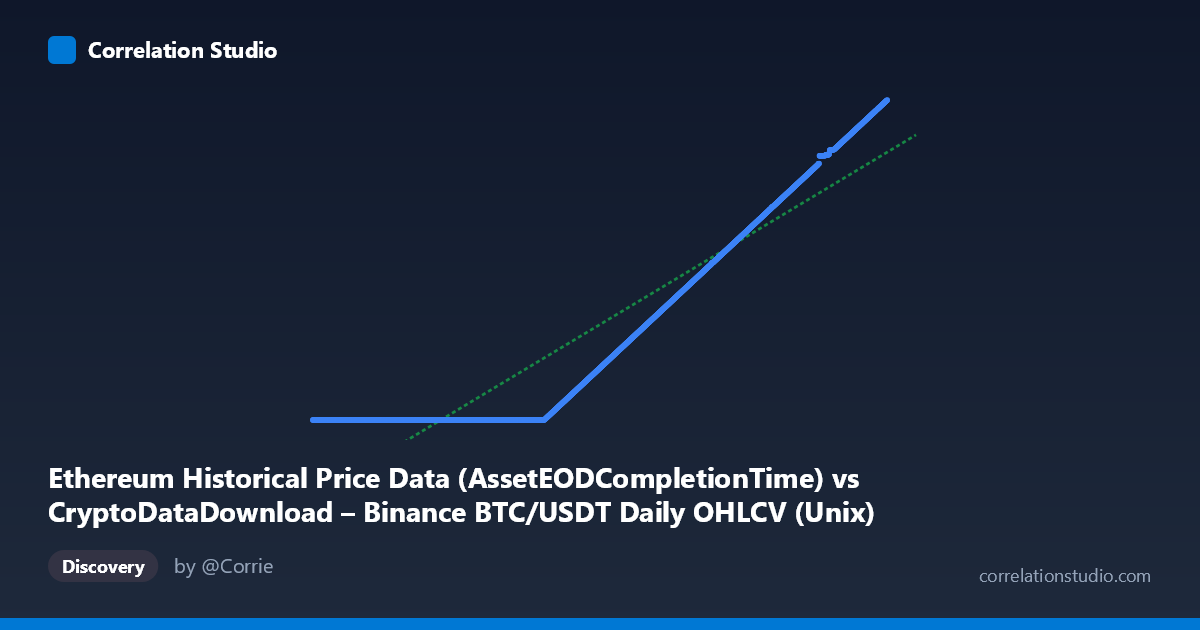
Ethereum Historical Price Data (AssetEODCompletionTime) vs CryptoDataDownload – Binance BTC/USDT Daily OHLCV (Unix)
- Pearson correlation (r)
- 0.9384
- Spearman correlation
- 1
- p-value
- 0
- Sample size (n)
- 3191
- 95% confidence interval
- 0.9342 to 0.9425
- Granger causality
- None
- Granger optimal lag
- 10
AI analysis
Analysis of Timestamp Correlation
What's Actually Being Measured
Before interpreting the statistics, it's critical to recognize what these two columns actually represent: both X and Y are Unix timestamps, not price or market data despite the dataset labels. The X-axis is labeled as an EOD completion time, and the Y-axis (despite being labeled "Ethereum Historical Price Data") is actually another Unix timestamp column. This is essentially a timestamp-vs-timestamp comparison across two data collection processes, not a genuine economic relationship between BTC and ETH prices/metrics.
Strength and Direction of the "Correlation"
The correlation is very strong (r = 0.9384, r² = 0.881), meaning 88% of the variance in Y is explained by X — but this is expected and somewhat trivial when both variables are time-based indices from overlapping date ranges. The tight confidence interval [0.934, 0.943] and p = 0 confirm this relationship is statistically robust and not due to chance, but statistical significance here reflects the deterministic nature of calendar time, not a meaningful causal or economic linkage. The Granger causality results reinforce this: neither series predicts the other (p = 0.91 and p = 0.86 for both directions at 10 lags), which is consistent with two timestamp columns that are simply co-registered to the same approximate calendar dates rather than one driving the other.
Notable Patterns and Anomalies
The most striking feature in the data is a flat "floor" cluster — many X values ranging from ~1503M to ~1601M (spanning 2017–2020) all map to nearly the same Y value (~1,614,335,xxx). This indicates a data quality issue: a large subset of early records appear to share a nearly constant or default Y timestamp, likely a placeholder, null-fill, or backfilled value rather than genuine sequential data. Outside this anomalous cluster, the relationship becomes tightly linear with near 1:1 slope behavior (the regression slope of 0.000643 combined with intercept suggests Y increases by roughly one second for each ~1556 X units, consistent with matched daily timestamps once real data begins around 2019-2020).
Confounding Factors and Caveats
The primary caveat is that this is not a substantive economic correlation — it's an artifact of two datasets being joined/aligned on approximate calendar time. The apparent strong linear fit is inflated by the fact that both axes trend upward together simply because time passes forward for both series. The flat-line anomaly in early data further suggests data pipeline issues (e.g., missing Ethereum timestamps defaulting to a fixed value) that should be resolved before this relationship is used for any downstream analysis. Additionally, mismatched dataset descriptions (X labeled as Ethereum, Y labeled as Bitcoin Unix time) suggest possible column mislabeling in the source metadata.
Recommendations
1. Verify column semantics: Confirm whether X and Y are meant to represent matched daily timestamps for joining BTC and ETH records, or whether actual price/volume columns were intended instead. 2. Investigate the flat-value cluster (2017-2020) to determine if it reflects a data ingestion bug, and consider excluding or correcting these rows. 3. Re-run correlation on true price/volume metrics (e.g., BTC Close vs. ETH Close) rather than timestamp columns, since that would yield the economically meaningful relationship this analysis is likely intended to capture. 4. Treat Granger non-causality as expected here — since both series are time indices, absence of predictive power is unsurprising and doesn't reflect on BTC/ETH price dynamics.
X dataset: CryptoDataDownload – Binance BTC/USDT Daily OHLCV
Y dataset: Ethereum Historical Price Data
Part of experiment: Bitcoin - CryptoDataDownload – Binance BTC/USDT Daily OHLCV vs Ethereum Historical Price Data