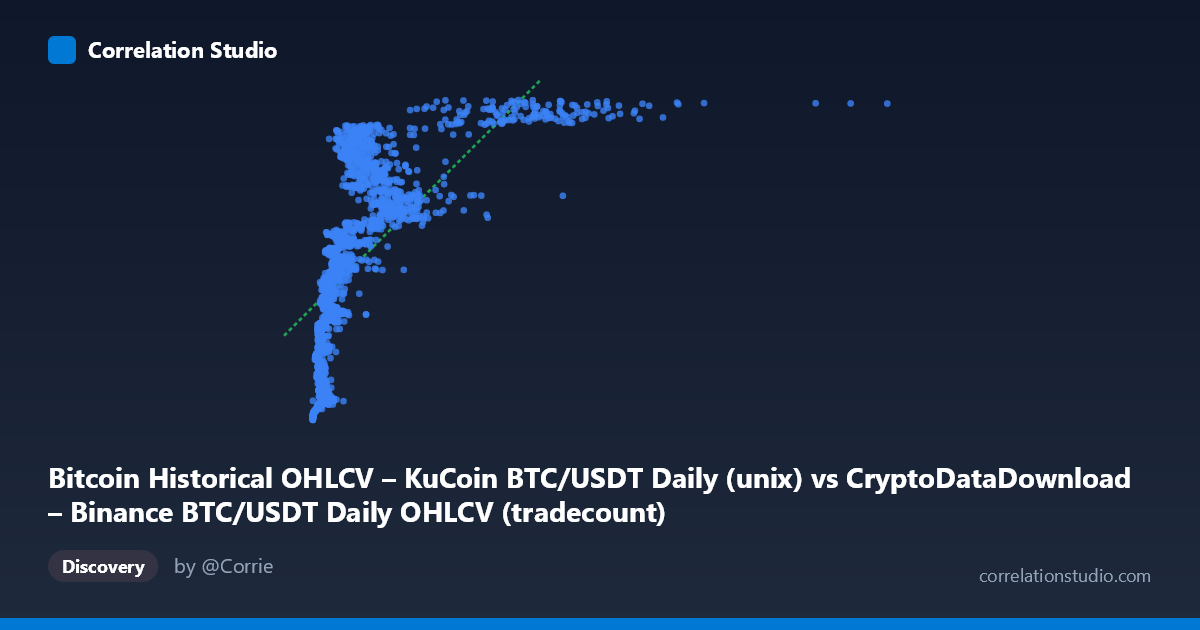
Bitcoin Historical OHLCV – KuCoin BTC/USDT Daily (unix) vs CryptoDataDownload – Binance BTC/USDT Daily OHLCV (tradecount)
- Pearson correlation (r)
- 0.6729
- Spearman correlation
- 0.8781
- p-value
- 0
- Sample size (n)
- 1861
- 95% confidence interval
- 0.6473 to 0.6971
- Granger causality
- None
- Granger optimal lag
- 10
- Time coverage
- 2017-10-19 to 2022-11-29
AI analysis
Analysis: Bitcoin Trading Volume (X) vs. Timestamp/Tradecount (Y)
1. Relationship Overview
Despite the axis labels appearing to reference a Unix timestamp for Y, the values (1.5–1.67 billion) combined with the description confirm Y is actually tradecount (daily number of trades), while X is a volume-like OHLCV metric. The scatterplot shows a clear positive, moderately strong relationship: as the volume metric increases, tradecount tends to rise as well, but the relationship is visibly non-linear — points cluster tightly at low X values and fan out with increasing scatter at higher X values, suggesting a concave (log-like) curve rather than a straight line.
2. Strength, Direction, and Statistical Confidence
The Pearson correlation (r = 0.673, r² = 0.453) indicates a moderate positive relationship, with only 45% of the variance in tradecount explained by this volume metric — leaving over half of the variation attributable to other factors. The 95% CI [0.647, 0.697] is narrow and the p-value is effectively zero, so despite the large unexplained variance, the correlation itself is highly statistically reliable given the large sample (n=1,861 daily observations). Critically, the Granger causality tests show no significant predictive direction in either direction (X→Y: p=0.128; Y→X: p=0.552) at 10 lags. This means neither variable reliably "leads" the other in time — they likely move together contemporaneously (both driven by overall market activity/volatility) rather than one causing or forecasting the other.
3. Notable Patterns and Non-linearity
The data shows heavy clustering at low X values (under ~1M) where Y ranges widely (roughly 1.51B–1.65B), indicating high tradecount variability even when volume is modest — likely reflecting different market regimes (bull vs. bear markets, retail vs. institutional activity) at similar volume levels. At high X values (5M, tail of the distribution), Y consistently sits at the upper range (~1.65B–1.67B), consistent with 2022's elevated trading activity. The note that Spearman ρ exceeds Pearson r confirms visual impressions of a monotonic but non-linear (likely logarithmic or power-law) relationship — sensible since trade count and volume often scale multiplicatively rather than additively, especially given X's huge range (8,305 to 14.5M, stdev nearly 1.3× the mean, indicating strong right-skew).
4. Confounding Factors and Caveats
Both variables are almost certainly confounded by overall market conditions and time trend: Bitcoin's exchange activity, volatility, and trader participation grew substantially from 2017 to 2022, so both volume and tradecount may simply be co-trending upward over the sample period rather than one directly influencing the other. The lack of Granger causality supports this — the correlation may be spurious in a causal sense, driven by a shared underlying driver (market growth, adoption, volatility clustering) rather than genuine bidirectional influence. Additionally, mixing exchanges (Binance X-axis description vs. KuCoin Y-axis description per the column details) means liquidity fragmentation, exchange-specific trading bot activity, or wash trading could differentially affect the two series.
5. Suggestions for Further Investigation
- Fit a log-log or power-law model instead of linear regression, given the Spearman/Pearson divergence and right-skewed X distribution — this should substantially improve fit quality. - Detrend both series (e.g., using log returns or first differences) before re-testing correlation and Granger causality, to control for the shared long-term market growth trend and isolate genuine short-term co-movement. - Segment by market regime (bull/bear/sideways, or by year) to check if the relationship strength or slope changes across different volatility environments — the fanning pattern suggests regime-dependent behavior. - Verify data provenance, since the axis descriptions appear crossed (Y-axis metadata references "tradecount" appended to what looks like KuCoin data, while X references Binance) — confirm both series are correctly aligned by date and exchange before drawing final conclusions.
X dataset: CryptoDataDownload – Binance BTC/USDT Daily OHLCV
Y dataset: Bitcoin Historical OHLCV – KuCoin BTC/USDT Daily
Part of experiment: Bitcoin - CryptoDataDownload – Binance BTC/USDT Daily OHLCV vs Bitcoin Historical OHLCV – KuCoin BTC/USDT Daily