US Employment and Unemployment (agrictulture_ratio) vs Open data: UK macroeconomic series from 1086 to present. Bank of England Millennium of Macroeconomic Data. (Year) (value)
- Pearson correlation (r)
- -0.6993
- Spearman correlation
- -0.9472
- p-value
- 0
- Sample size (n)
- 76
- 95% confidence interval
- -0.7988 to -0.5625
- Granger causality
- None
- Granger optimal lag
- 10
- Time coverage
- 1941-01-01 to 2016-01-01
AI analysis
Analysis of US Agriculture Employment Ratio vs. UK Macroeconomic Value (1941–2016)
1. What the Visualization Reveals
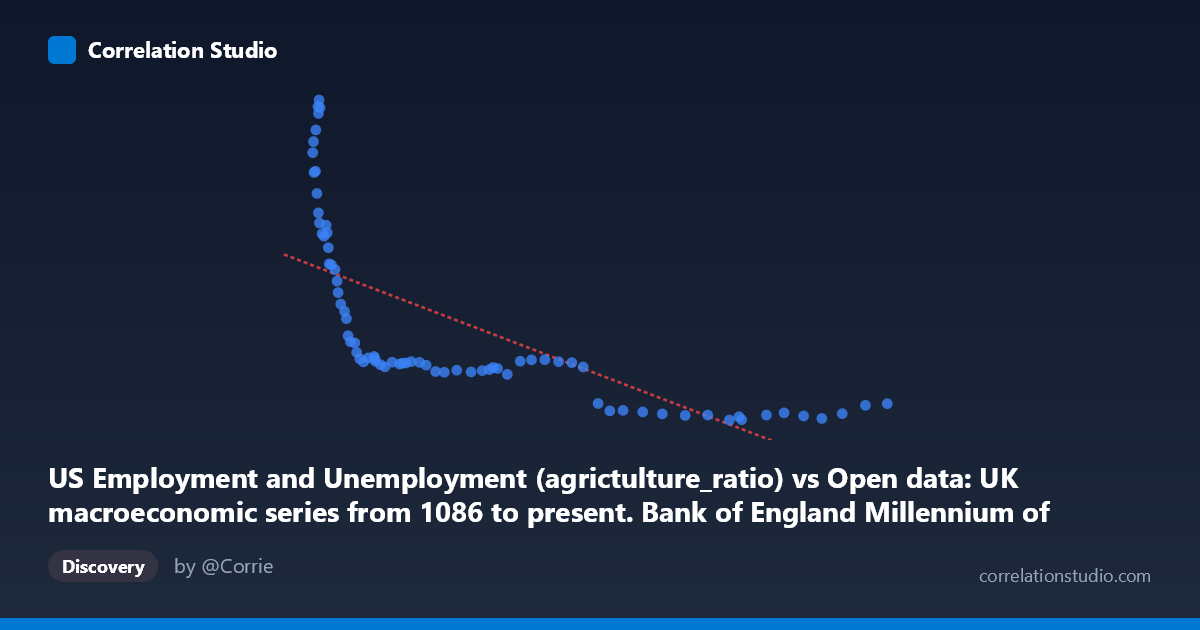
The scatterplot displays a clear negative relationship between the US agriculture employment ratio (X-axis, ranging from ~33,000 to ~469,000) and a UK macroeconomic value — likely a wage, income, or price-level series from the Bank of England dataset (Y-axis, ranging from ~2,095 to ~9,250). As the US agriculture ratio increases toward lower values on the X-axis (i.e., smaller values), the UK metric tends to be substantially higher, while larger X values correspond to compressed, lower Y values. Visually, the data forms a distinctive hyperbolic or exponential decay curve rather than a straight line, with a dense cluster at low Y values (roughly 2,000–3,500) across the higher range of X, and a dramatic upward sweep at the left side of the chart where X is smallest.
2. Correlation Strength, Direction, and Statistical Framing
The Pearson correlation of r = −0.699 indicates a moderately strong negative linear association, and the coefficient of determination r² = 0.489 means that approximately 49% of the variance in the UK macroeconomic series is statistically explained by the US agriculture employment ratio — a meaningful but far from complete relationship. The remaining ~51% of variance is attributable to other factors not captured here. The 95% confidence interval of [−0.799, −0.563] is entirely negative and reasonably tight, confirming the direction of the relationship is robust, and the p-value of 2.12 × 10⁻¹² makes this correlation highly statistically significant, effectively ruling out chance as an explanation given the sample of n = 76 paired observations.
However, the Granger causality tests are both non-significant (X→Y: F = 1.33, p = 0.24; Y→X: F = 0.93, p = 0.52), meaning that neither series temporally predicts the other even at an optimal lag of 10 periods. This is a critical caveat: despite the strong correlation, there is no evidence of directional predictive causality in either direction, suggesting the relationship is likely driven by shared temporal trends (both series evolving over the same 1941–2016 period) rather than one variable mechanistically influencing the other.
3. Notable Patterns, Clusters, and Non-Linear Features
The most striking visual feature is the pronounced non-linear, concave curve in the data — precisely why the note flags that Spearman ρ exceeds Pearson r, suggesting a logarithmic or power-law fit would substantially outperform the linear regression. Three distinct zones are visible: (1) a high-Y, low-X cluster (roughly X < 60,000, Y = 5,000–9,250) showing high variance and dramatic spread — these likely represent earlier decades when US agricultural employment was proportionally much larger; (2) a transition zone (X ≈ 60,000–130,000, Y ≈ 3,400–5,000) where Y drops rapidly; and (3) a compressed plateau cluster (X 130,000, Y ≈ 2,100–3,500) where the relationship flattens considerably. Several high-leverage outliers exist in the upper-left quadrant (e.g., points near Y = 9,250 and Y = 9,100 at very low X values), which likely correspond to early post-WWII observations and may disproportionately influence the Pearson r.
4. Confounding Factors and Interpretive Caveats
The most fundamental caveat is that this correlation almost certainly reflects parallel long-run secular trends rather than any genuine economic linkage between US agricultural employment and UK macroeconomic conditions. Both series are strongly time-indexed: US agricultural employment as a share of the labor force declined dramatically from the 1940s onward due to mechanization and structural economic shifts, while many UK macroeconomic indicators (wages, prices) rose substantially over the same period. This creates a spurious correlation driven by shared time trends — a classic confound in cross-national long-run time series analysis. The datasets are also of mixed provenance (BLS US employment data cross-joined with Bank of England millennium macro data), and the Y-axis label ambiguity ("value" column) raises questions about what specific UK series is being measured and whether units are consistent across decades. Additionally, the linear regression (y = −0.0113x + 5,926.75) is a poor functional form given the evident non-linearity, meaning the stated r² of 48.9% likely understates how well a curved model could fit the data.
5. Actionable Insights and Further Investigation
Given the non-linear visual pattern, the immediate next step should be fitting a logarithmic or power-law regression (e.g., Y = a·ln(X) + b or Y = a·X^b), which would almost certainly explain considerably more variance and better capture the asymptotic behavior at high X values. Researchers should also detrend both series (e.g., via first-differencing or HP filtering) before drawing any inferential conclusions, to isolate whether any genuine co-movement exists beyond shared time trends. Identifying precisely which Bank of England series the Y-axis represents is essential — if it is a nominal wage or price index, the correlation with declining agricultural employment ratios may partly reflect genuine structural economic transformation narratives worth exploring in a cointegration framework. Finally, extending the Granger causality test with detrended data and exploring cointegration (Engle-Granger or Johansen tests) would be far more informative than the raw-level Granger tests reported here, as non-stationary series frequently produce misleading Granger results.
X dataset: Open data: UK macroeconomic series from 1086 to present. Bank of England Millennium of Macroeconomic Data. (Year)
Y dataset: US Employment and Unemployment
Part of experiment: Yearly - Open data: UK macroeconomic series from 1086 to present. Bank of England Millennium of Macroeconomic Data. (Year) vs US Employment and Unemployment