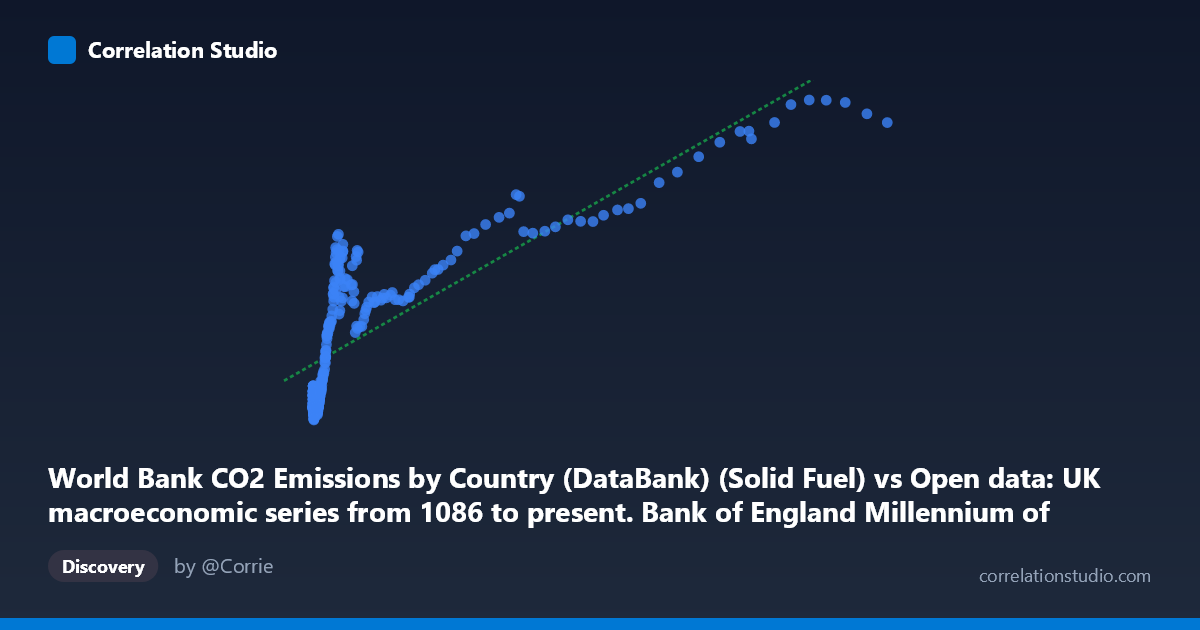
World Bank CO2 Emissions by Country (DataBank) (Solid Fuel) vs Open data: UK macroeconomic series from 1086 to present. Bank of England Millennium of Macroeconomic Data. (Year) (value)
- Pearson correlation (r)
- 0.8123
- Spearman correlation
- 0.8811
- p-value
- 0
- Sample size (n)
- 266
- 95% confidence interval
- 0.7669 to 0.8495
- Granger causality
- None
- Granger optimal lag
- 10
AI analysis
Analysis: UK Solid Fuel CO2 Emissions vs. UK Macroeconomic Value
Relationship Overview The scatterplot reveals a positive, moderately strong relationship between World Bank solid fuel CO2 emissions and the Bank of England UK macroeconomic series value. As solid fuel emissions increase, the macroeconomic indicator tends to rise in a broadly consistent pattern, though with considerable dispersion at higher emission levels. The linear regression equation (y = 0.0652x + 6,467.59) indicates a relatively shallow slope, meaning large increases in emissions correspond to modest absolute gains in the macroeconomic variable. This is consistent with what one might expect from a long historical series where both economic output and industrial emissions grew in tandem across centuries of industrialization before eventually decoupling.
Correlation Strength and Statistical Significance The Pearson correlation of r = 0.8123 signals a strong positive association, and the R² of 0.6598 confirms that approximately 66% of the variance in the macroeconomic variable is statistically explained by solid fuel emissions. That leaves roughly 34% attributable to other factors, which is non-trivial. The 95% confidence interval of [0.767, 0.850] is relatively tight, indicating the estimate is stable, and the p-value of essentially zero confirms this correlation is not a chance finding given n = 266 paired observations drawn from a population of N = 18,769. However, the Granger causality results complicate the narrative significantly: neither direction (X→Y: p = 0.534; Y→X: p = 0.094) achieves conventional significance at the optimal 10-period lag. This means that while the two series are strongly correlated, neither reliably predicts the other temporally — a crucial caution against any causal interpretation.
Patterns, Clusters, and Outliers The sample points reveal a clear clustering structure: a dense concentration of observations at lower emission values (roughly below 50,000 units) where the macroeconomic values span a wide range from ~1,500 to ~17,000, and a more dispersed upper tail where emissions exceed 100,000–400,000 units and macroeconomic values reach 18,000–28,000+. This upper-tail behavior (e.g., points near 298,000/24,455 and 356,000/28,261) suggests a logarithmic or power-law relationship may fit better than the fitted linear model, with diminishing returns in macroeconomic value per unit of additional emissions at high levels. A few points near the origin with unexpectedly high Y values (e.g., ~2,060/2,554 and ~2,175/4,104) could represent early historical periods where the macroeconomic metric was non-trivially elevated relative to very low fossil fuel use — potential outliers worth examining individually.
Confounding Factors and Caveats Several serious confounding factors warrant caution. Both series are strongly trended over time (1751–2016), meaning the correlation may largely reflect shared temporal trends — the classic spurious correlation problem with non-stationary time series — rather than any meaningful structural link. The "UK macroeconomic series" label is also ambiguous: it could represent GDP, wages, debt, or equity values, each carrying very different interpretive implications. The dataset join itself is potentially problematic, as the World Bank CO2 data covers global or country-level emissions while the macroeconomic series is specifically UK-focused, and it is unclear whether the emissions column represents UK-specific solid fuel use or a broader aggregate. The absence of Granger causality at 10 lags further suggests the apparent relationship may dissolve under proper time-series controls (e.g., differencing, cointegration testing).
Actionable Insights and Further Investigation Given the strong correlation but absent Granger causality, the priority next step should be testing for cointegration (e.g., Engle-Granger or Johansen tests) to determine whether these series share a long-run equilibrium relationship beyond shared trending. Researchers should explicitly confirm the emissions column represents UK solid fuel use rather than a global or mismatched aggregate, as a dataset join error could entirely explain the correlation. A log-transformation of the X variable is strongly recommended given the right-skewed X distribution (mean 50,086, stdev 92,253) and the apparent non-linearity visible in the scatter; this would likely improve both fit and interpretability. Finally, controlling for time as a covariate in a multiple regression framework would help isolate whether any relationship persists beyond the shared industrialization-era trend — the most critical test before drawing any policy or economic conclusions from this association.
X dataset: Open data: UK macroeconomic series from 1086 to present. Bank of England Millennium of Macroeconomic Data. (Year)
Y dataset: World Bank CO2 Emissions by Country (DataBank)
Part of experiment: Yearly - Open data: UK macroeconomic series from 1086 to present. Bank of England Millennium of Macroeconomic Data. (Year) vs World Bank CO2 Emissions by Country (DataBank)