FRED – Corporate Bond Yield (Moody's Aaa) (AAA) vs Brent Daily Spot Prices (Price)
- Pearson correlation (r)
- -0.6673
- Spearman correlation
- -0.7049
- p-value
- 0
- Sample size (n)
- 296
- 95% confidence interval
- -0.7261 to -0.5989
- Granger causality
- None
- Granger optimal lag
- 1
AI analysis
Analysis: Brent Crude Oil Prices vs. Moody's Aaa Corporate Bond Yields
Relationship Overview
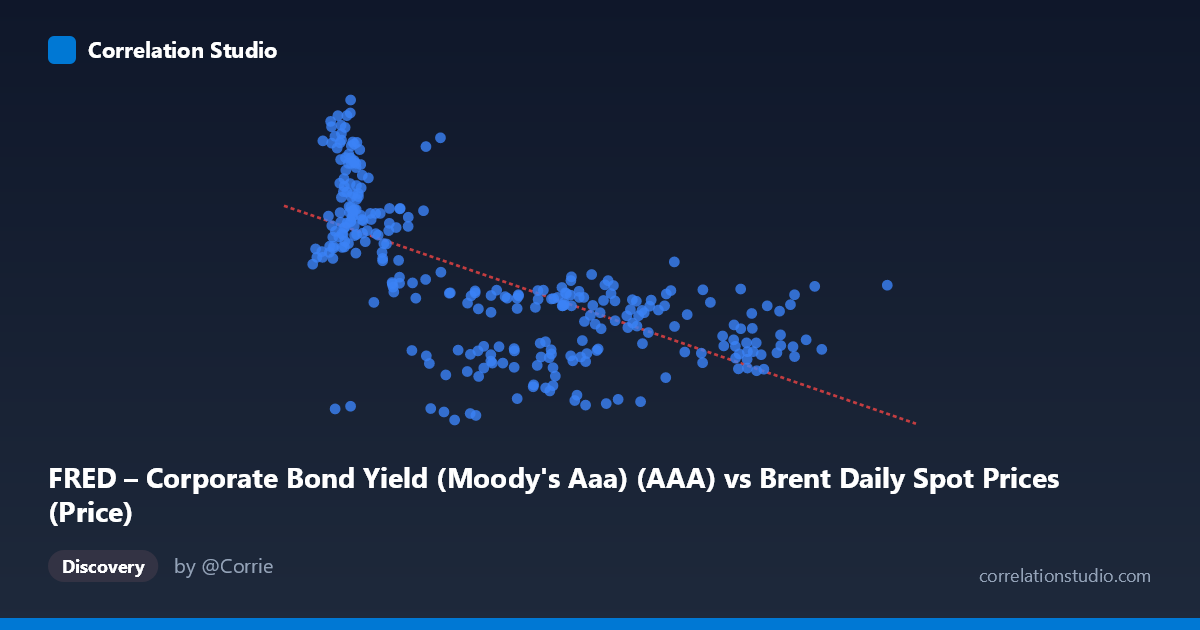
The scatterplot reveals a moderate negative relationship between Brent crude oil spot prices (X) and Moody's Aaa corporate bond yields (Y), summarized by the regression equation y = −0.0397x + 7.88. As oil prices increase, bond yields tend to decrease — a counterintuitive finding at first glance, but one that likely reflects the shared macroeconomic timeline both series have traversed since 1987. Low oil prices cluster in the upper-left region of the plot (yields of 7–10%, oil below ~$30/barrel), corresponding broadly to the late 1980s and 1990s, while higher oil prices congregate in the lower-right (yields of 2–6%, oil above $60/barrel), reflecting the post-2000s era of rising commodity prices and secular interest rate decline.
Correlation Strength and Statistical Interpretation
The Pearson correlation of r = −0.667 indicates a moderate-to-strong negative association, and the R² of 0.445 means that roughly 44.5% of the variance in bond yields is statistically explained by oil prices within this sample. While that is non-trivial, it also means 55.5% of yield variation is unexplained by this single variable — a critical caveat. The 95% confidence interval of [−0.726, −0.599] is relatively narrow given the large sample (N = 1,288, n = 296), and the p-value of ~0 confirms the relationship is statistically significant beyond any reasonable doubt. However, Granger causality tests tell a very different story: neither direction (X→Y: F = 0.67, p = 0.41; Y→X: F = 0.04, p = 0.85) approaches significance, meaning neither variable temporally predicts the other at a one-period lag. This is a crucial distinction — the correlation is real, but there is no detectable predictive or causal temporal signal between them.
Notable Patterns and Non-Linearity
Several structural features are visible in the data. There is a pronounced high-yield cluster at low oil prices (roughly $10–$25/barrel, yields 6–10%), consistent with 1980s–1990s data when the Fed funds rate and long-term rates were broadly elevated. A second dense mid-range cluster appears around $50–$120/barrel with yields compressed into the 2–6% band, reflecting post-2008 quantitative easing and the commodity supercycle. Notably, some outliers resist the trend: points like (38.95, 9.53) and (56.42, 2.70) suggest episodes where the relationship broke down. The relationship also appears non-linear — yields plateau near a floor (~2–3%) regardless of how high oil prices climb, suggesting a ceiling effect driven by monetary policy constraints rather than oil markets.
Confounding Factors and Caveats
This correlation almost certainly reflects co-movement through shared time trends rather than a genuine economic mechanism linking oil prices to bond yields. Both variables are heavily influenced by the secular decline in global interest rates from the late 1980s through the 2020s, which coincided with rising oil demand and price escalation. Central bank policy (Federal Reserve rate cycles, QE programs), inflation regimes, global growth phases, and geopolitical shocks (Gulf War, 2008 financial crisis, COVID-19) are powerful confounders that drove both series simultaneously. The Granger test's null result reinforces this: the correlation is a statistical artifact of shared macro history, not a predictive economic linkage. Treating this as a tradeable or causal relationship would be misleading.
Actionable Insights and Further Investigation
Given these findings, several follow-up analyses are warranted. First, detrending both series (e.g., first-differencing or HP filtering) before computing correlation would test whether any relationship persists once shared secular trends are removed — the most important next step. Second, regime-segmented analysis (pre/post-2008, or by Fed tightening vs. easing cycles) could reveal whether the correlation strengthens or reverses in specific macro environments. Third, incorporating inflation expectations or real interest rates would help disentangle the monetary policy channel from any oil-specific effect. Finally, extending the Granger test to multiple lags (beyond lag 1) and including control variables in a VAR framework would provide a more rigorous test of any predictive dynamics. As it stands, the relationship is statistically robust but economically spurious — driven by time, not mechanism.
X dataset: Brent Daily Spot Prices
Y dataset: FRED – Corporate Bond Yield (Moody's Aaa)
Part of experiment: Daily - Brent Daily Spot Prices vs FRED – Corporate Bond Yield (Moody's Aaa)