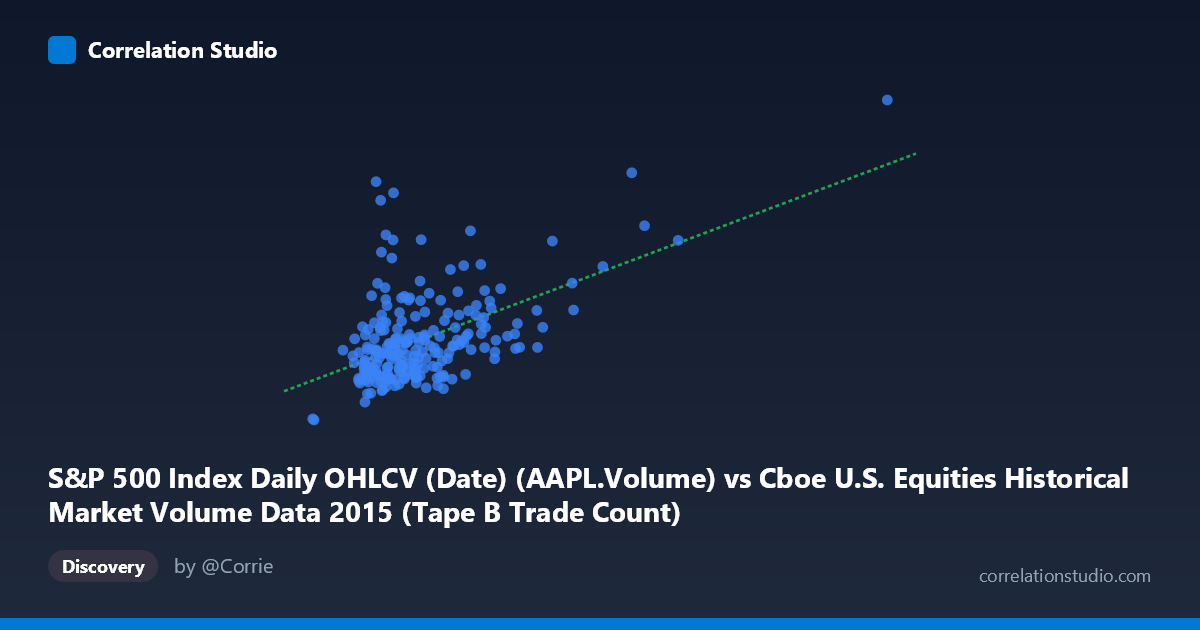
S&P 500 Index Daily OHLCV (Date) (AAPL.Volume) vs Cboe U.S. Equities Historical Market Volume Data 2015 (Tape B Trade Count)
- Pearson correlation (r)
- 0.5329
- Spearman correlation
- 0.3894
- p-value
- 0
- Sample size (n)
- 222
- 95% confidence interval
- 0.4315 to 0.621
- Granger causality
- None
- Granger optimal lag
- 10
AI analysis
Scatterplot Analysis: AAPL Volume vs. Cboe Tape B Trade Count (2015)
Relationship Overview The scatterplot reveals a moderate positive relationship between Apple Inc.'s daily trading volume (S&P 500 OHLCV dataset) and the Cboe U.S. Equities Tape B Trade Count for 2015. As AAPL volume increases, Tape B trade counts tend to rise correspondingly, which is intuitively reasonable — days with heightened activity in a major index constituent like AAPL likely reflect broader market conditions driving elevated trading activity across exchange venues. The linear regression equation (y = 113.92x + 16,661,900) suggests that each additional unit of AAPL volume is associated with approximately 114 additional Tape B trades, though this relationship carries substantial noise around the regression line.
Correlation Strength and Statistical Significance The Pearson correlation of r = 0.5329 indicates a moderate positive association, but the explanatory power is notably limited: r² = 0.2840 means only 28.4% of the variance in Tape B trade counts is explained by AAPL volume, leaving over 70% attributable to other factors. The 95% confidence interval of [0.4315, 0.6210] is reasonably tight and does not approach zero, and the p-value of effectively 0 confirms this correlation is highly statistically significant across the 222 paired observations. However, statistical significance should not be conflated with practical or causal significance. Critically, the Granger causality analysis finds no significant predictive direction in either direction — neither X→Y (F=1.18, p=0.31) nor Y→X (F=0.75, p=0.67) — meaning that past values of AAPL volume do not help forecast future Tape B trade counts, and vice versa. This strongly suggests the correlation reflects co-movement driven by shared external forces rather than any directional temporal predictive relationship.
Notable Patterns, Clusters, and Outliers The data exhibits several structurally important features. The bulk of observations cluster in the lower-left region — AAPL volumes roughly between 130,000–400,000 and Tape B counts between ~13M–80M — suggesting these represent typical, low-volatility trading days. However, there are at least two prominent outliers that significantly influence the regression: one extreme point near (1,014,195; 162,206,300) and another near (640,679; 103,601,600), both of which appear to correspond to high-volatility market events in 2015 (potentially the August flash crash or major Fed announcement days). Within the main cluster, scatter is wide and heteroscedastic — variance in Y appears to increase with X — which violates a key assumption of linear regression and suggests the linear model may underfit the true relationship. A few mid-range AAPL volume days (e.g., ~228,000 volume with Tape B counts exceeding 124M) also appear anomalous, indicating days where Tape B activity spiked independent of AAPL-specific volume.
Confounding Factors and Caveats Several important caveats temper interpretation. First, AAPL volume and Tape B trade counts are both downstream indicators of overall market activity — macroeconomic announcements, earnings seasons, geopolitical events, and VIX spikes would simultaneously elevate both variables, creating spurious correlation without a direct mechanistic link. Second, the datasets originate from different sources with potentially different aggregation methodologies, introducing measurement inconsistency. Third, the heteroscedasticity observed in the scatterplot means standard error estimates and confidence intervals may be unreliable without correction. Fourth, the time coverage (Feb–Dec 2015) captures a period of notable market stress, and the extreme outliers may be disproportionately pulling the correlation upward — removing them could meaningfully reduce r. Finally, the dataset label descriptions appear to have their source/column assignments potentially transposed (AAPL volume listed under Cboe dataset and vice versa), which warrants verification before drawing firm conclusions.
Actionable Insights and Further Investigation Given the moderate but noise-heavy correlation and the absence of Granger causality, AAPL volume alone is a poor predictor of Tape B trade counts and should not be used in isolation for forecasting. Recommended next steps include: (1) re-running the analysis with outlier exclusion or robust regression to assess whether the two extreme high-volume days are driving the bulk of the observed r; (2) testing a log-log or power transformation to address heteroscedasticity and potentially improve model fit; (3) incorporating VIX or overall NYSE composite volume as a control variable to isolate whether any residual AAPL-specific effect exists beyond broad market activity; (4) expanding the time window beyond 2015 to test whether this correlation is stable or period-specific; and (5) clarifying the apparent dataset column assignment discrepancy to ensure analytical validity before publishing or acting on these findings.
X dataset: Cboe U.S. Equities Historical Market Volume Data 2015
Y dataset: S&P 500 Index Daily OHLCV (Date)
Part of experiment: Daily - Cboe U.S. Equities Historical Market Volume Data 2015 vs S&P 500 Index Daily OHLCV (Date)