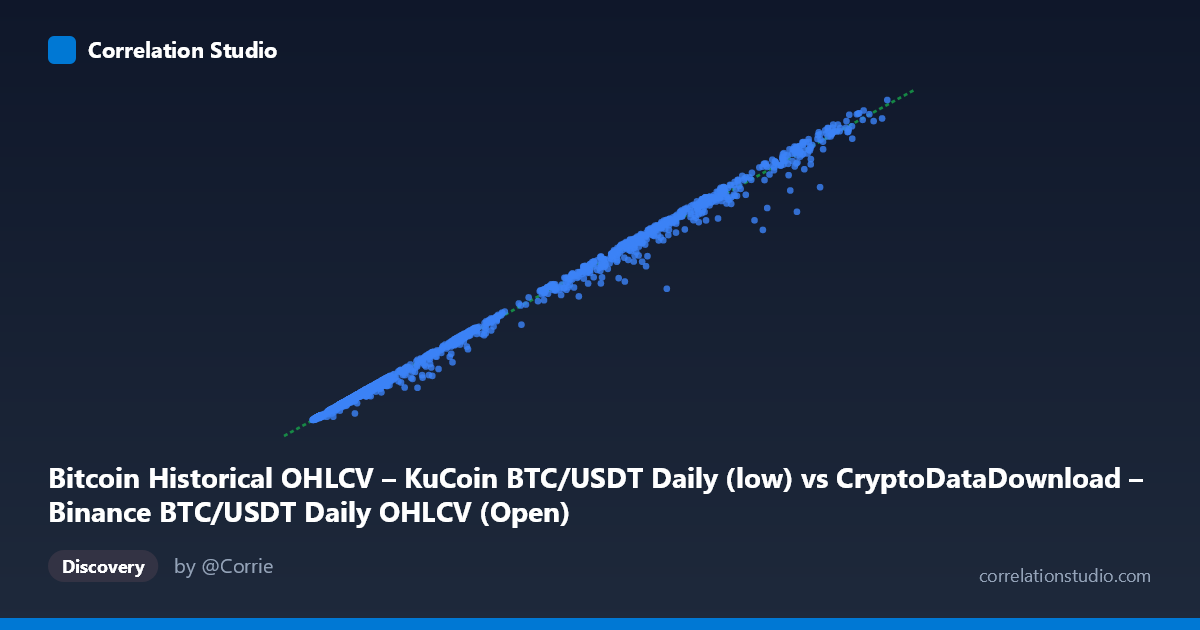
Bitcoin Historical OHLCV – KuCoin BTC/USDT Daily (low) vs CryptoDataDownload – Binance BTC/USDT Daily OHLCV (Open)
- Pearson correlation (r)
- 0.9982
- Spearman correlation
- 0.9979
- p-value
- 0
- Sample size (n)
- 1861
- 95% confidence interval
- 0.9981 to 0.9984
- Granger causality
- None
- Granger optimal lag
- 10
- Time coverage
- 2017-10-19 to 2022-11-29
AI analysis
Analysis: BTC/USDT Price Correlation (Binance Low vs. KuCoin Open)
1. Relationship Overview
This scatterplot compares two price series for the same underlying asset (Bitcoin/USDT) sourced from two different exchanges: Binance's daily "Low" price and KuCoin's daily "Open" price. As expected, the visualization shows an almost perfectly linear relationship, with points tightly hugging a line with slope ≈0.966 and near-zero intercept (14.22). This is not a discovery of a novel relationship but rather a confirmation that two proxies for the same market are tracking each other with extremely high fidelity across a wide price range (~$3,200 to ~$67,500), spanning the 2017–2022 period that includes multiple bull/bear cycles.
2. Strength, Direction, and Uncertainty
The correlation is exceptionally strong and positive (r = 0.9982), with r² = 0.9965 indicating that 99.65% of the variance in KuCoin's opening price is statistically explained by Binance's low price. The 95% CI [0.9981, 0.9984] is extremely narrow, reflecting the large sample size (n=1,861) and the low-noise nature of the relationship — there is essentially no uncertainty that this correlation is real and robust (p≈0). However, "explains variance" here is largely mechanical: both series are near-identical measurements of the same asset's price, not two independent phenomena that happen to move together. The Granger causality results (p=0.24 and p=0.21 for both directions) show no significant lead-lag relationship at a 10-day lag — neither series meaningfully predicts future values of the other beyond what's already known contemporaneously. This is consistent with efficient, near-instantaneous cross-exchange price arbitrage: prices adjust together rather than one exchange leading the other over multi-day horizons.
3. Notable Patterns and Deviations
The regression slope (0.966) and small positive intercept suggest KuCoin's open is very slightly compressed relative to Binance's low (makes sense, since "low" is definitionally ≤ "open" on any given day for the same asset). Sampled data points reinforce this: most pairs are within 1–5% of each other (e.g., 42201.13 vs 40910.90, ~3% gap), but a few show larger divergences — notably (44865.26, 40683.00), a ~9.3% gap, and (31017.11, 27767.10), a ~10.5% gap. These likely correspond to high-volatility days (flash crashes, exchange-specific liquidity gaps, or news-driven price dislocations) where cross-exchange arbitrage temporarily lags. No clear non-linear curvature is apparent — the relationship holds proportionally across the full price range from ~$3,200 to ~$67,500, suggesting no regime change or saturation effect.
4. Confounding Factors and Caveats
The central caveat is that this is not an economic relationship between two distinct variables — it's two measurements of one asset's price, so near-perfect correlation is expected by construction rather than indicative of a discoverable causal link. Key confounders/artifacts to consider: (a) differing "Low" vs. "Open" price definitions inherently introduce a systematic small gap; (b) both venues may have gaps, missing days, or timestamp misalignment (UTC day boundaries can differ), introducing noise particularly visible in the outlier pairs; (c) trading volume and liquidity differences between Binance and KuCoin could cause momentary divergence during volatile periods, and (d) the long time span (2017–2022) means Bitcoin's absolute volatility regime changed substantially, so heteroscedasticity (larger absolute gaps at higher price levels) is likely even though relative gaps stay similar.
5. Suggested Next Steps
Given the trivial nature of the correlation, more insight would come from analyzing the residuals rather than the correlation itself: (1) compute and plot (KuCoinopen − Binancelow)/Binancelow over time to detect periods of unusual cross-exchange divergence (arbitrage opportunities or liquidity stress events); (2) investigate whether residual spikes correlate with known volatility events (e.g., May 2021 crash, FTX collapse in Nov 2022); (3) since Granger causality shows no lead-lag at daily/10-day granularity, try much shorter (intraday/hourly) lags where cross-exchange arbitrage speed could actually be measurable; and (4) rather than "Low vs Open," consider comparing same-metric prices (e.g., both Opens or both Closes) to isolate genuine cross-exchange premium/discount rather than an artifact of comparing different intraday reference points.
X dataset: CryptoDataDownload – Binance BTC/USDT Daily OHLCV
Y dataset: Bitcoin Historical OHLCV – KuCoin BTC/USDT Daily
Part of experiment: Bitcoin - CryptoDataDownload – Binance BTC/USDT Daily OHLCV vs Bitcoin Historical OHLCV – KuCoin BTC/USDT Daily