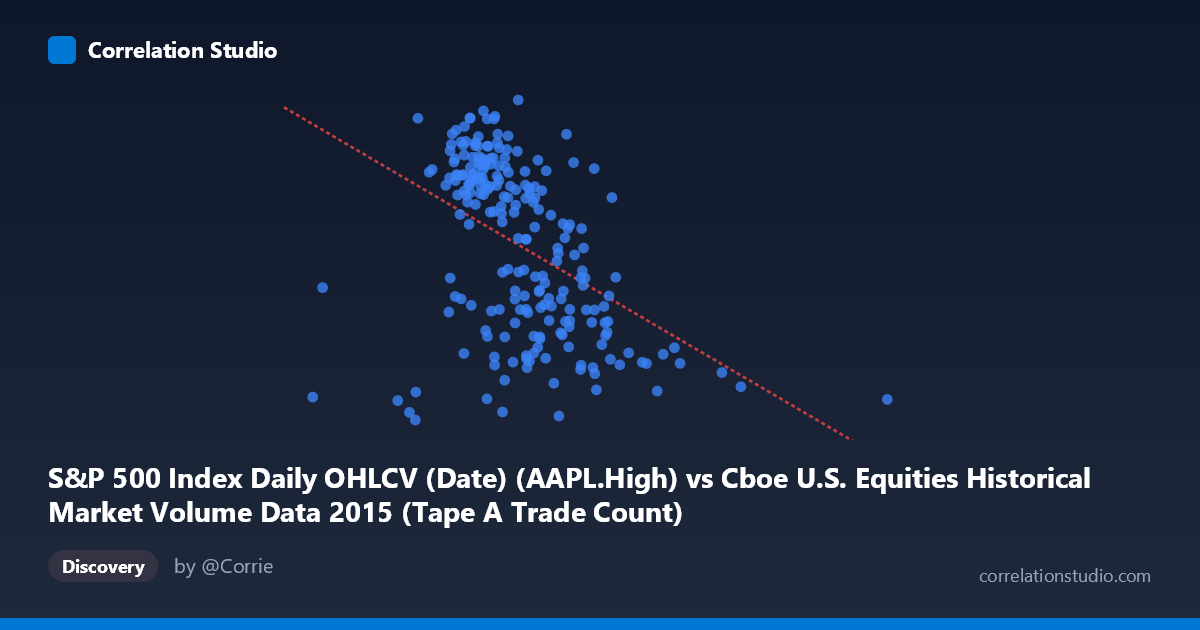
S&P 500 Index Daily OHLCV (Date) (AAPL.High) vs Cboe U.S. Equities Historical Market Volume Data 2015 (Tape A Trade Count)
- Pearson correlation (r)
- -0.4436
- Spearman correlation
- -0.5053
- p-value
- 0
- Sample size (n)
- 222
- 95% confidence interval
- -0.5436 to -0.3313
- Granger causality
- None
- Granger optimal lag
- 1
AI analysis
Scatterplot Analysis: AAPL High Price vs. Cboe Tape A Trade Count (2015)
1. Relationship Overview The scatterplot reveals a moderate negative relationship between Apple's daily high price (S&P 500 OHLCV dataset) and Cboe U.S. Equities Tape A trade count across the 2015 trading year. As AAPL's daily high price increases, the Tape A trade count tends to decrease. The linear regression equation (y = -1.23455E-05x + 139.576) reflects this inverse trajectory, suggesting that higher AAPL price levels coincide with reduced overall Cboe equity trade counts — a perhaps counterintuitive finding that warrants careful interpretation. The data spans from mid-February through end of December 2015, capturing a meaningful portion of a year that included notable volatility events such as the August 2015 market correction.
2. Correlation Strength, Direction, and Causality The correlation coefficient of r = -0.4436 indicates a moderate negative association, but the variance explained metric tells a more sobering story: r² = 0.1968 means only ~19.7% of the variance in Tape A trade count is explained by AAPL's high price. The remaining ~80% is attributable to other factors entirely. The 95% confidence interval of [-0.5436, -0.3313] is meaningfully bounded away from zero, and the p-value of 4.03E-12 confirms the relationship is highly statistically significant — this is not a chance finding given n = 222 paired observations. However, statistical significance does not imply practical or causal significance. Critically, Granger causality tests reveal no significant predictive directionality in either direction (X→Y: F = 0.628, p = 0.429; Y→X: F = 0.014, p = 0.907), meaning neither variable temporally predicts the other at a 1-period lag. This effectively rules out a straightforward leading-indicator relationship between AAPL price movements and Tape A volume activity.
3. Notable Patterns, Clusters, and Outliers The scatterplot exhibits several noteworthy structural features. The bulk of observations cluster between roughly X = 1,100,000–1,600,000 (AAPL high price range approximately $110–$134), with Y values spanning 107–134 trade count units, forming a diffuse but discernible downward-sloping cloud. There are at least two prominent outliers on the far right of the X-axis — notably the point at approximately (2,923,236, 108.80) and another near (2,247,816, 111.11) — which sit far outside the main cluster and likely correspond to anomalous trading days or data irregularities. These high-leverage points could be disproportionately influencing the regression slope and the overall correlation estimate. Additionally, a low-end outlier near (616,505, 118.41) sits isolated at the far left. Within the main cluster, the relationship appears somewhat heteroscedastic, with greater Y-spread at mid-range X values, suggesting the linear model may not be fully capturing the data structure.
4. Confounding Factors and Interpretive Caveats Several important caveats apply to this analysis. Most fundamentally, the two variables originate from swapped dataset assignments — AAPL High is sourced from the Cboe dataset column, and Tape A Trade Count from the S&P 500 OHLCV dataset — suggesting a possible data join or labeling issue that could undermine the integrity of the pairing. Even setting that aside, the negative correlation likely reflects a shared temporal confound: AAPL's price was generally declining through late 2015 (particularly post-August correction) while market volume and trade counts were elevated during high-volatility periods, creating a spurious inverse co-movement driven by a common third factor — market volatility or investor sentiment — rather than any direct relationship between the two variables. The N = 506 population versus n = 222 sample also suggests incomplete pairing, which may introduce selection bias. The extreme right-side outliers (possibly data entry errors or corporate action dates) further distort the linear fit.
5. Actionable Insights and Further Investigation Given the limited explanatory power (19.7% variance explained) and absence of Granger causality, AAPL's high price should not be used as a standalone predictor of Cboe Tape A trade counts in any practical trading or market microstructure model. Recommended next steps include: (1) verifying and correcting the dataset column assignments to ensure valid pairing; (2) investigating and potentially removing or winsorizing the extreme outliers near X = 2.2M and 2.9M to assess their influence on the correlation; (3) introducing VIX or realized volatility as a control variable to test whether the apparent negative correlation is fully mediated by market-wide volatility; (4) exploring non-linear or segmented regression models, as the relationship may behave differently in low-price versus high-price regimes; and (5) extending the Granger causality test to longer lags (2–5 periods) before concluding no temporal predictive relationship exists, as the current test only evaluates a 1-day lag.
X dataset: Cboe U.S. Equities Historical Market Volume Data 2015
Y dataset: S&P 500 Index Daily OHLCV (Date)
Part of experiment: Daily - Cboe U.S. Equities Historical Market Volume Data 2015 vs S&P 500 Index Daily OHLCV (Date)