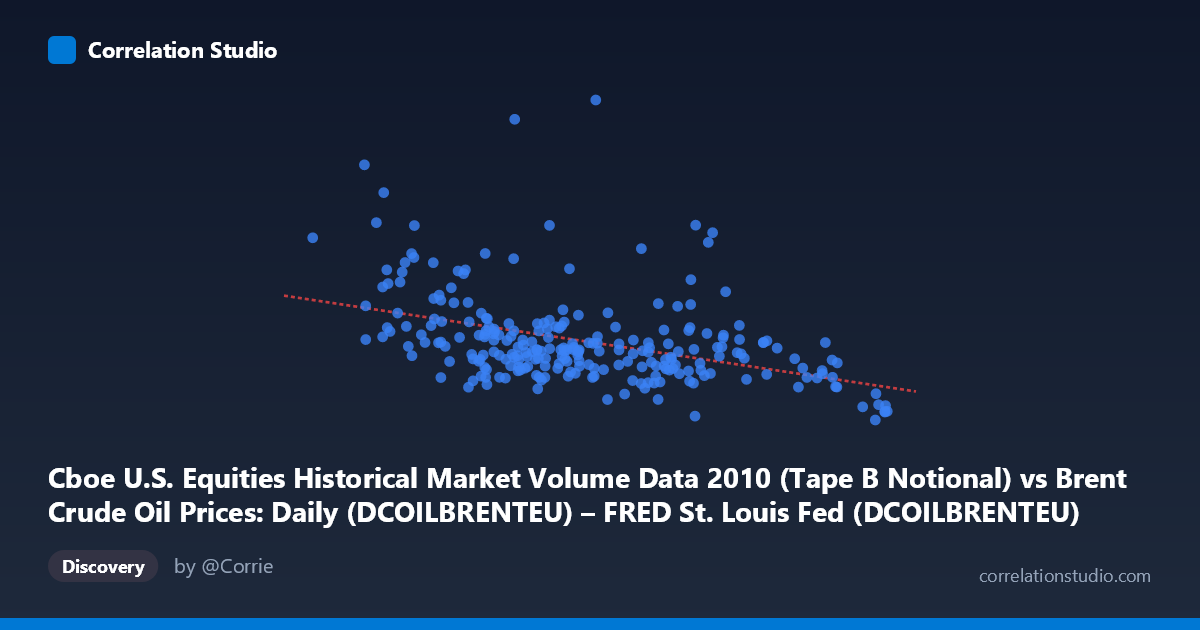
Cboe U.S. Equities Historical Market Volume Data 2010 (Tape B Notional) vs Brent Crude Oil Prices: Daily (DCOILBRENTEU) – FRED St. Louis Fed (DCOILBRENTEU)
- Pearson correlation (r)
- -0.4224
- Spearman correlation
- -0.4469
- p-value
- 0
- Sample size (n)
- 252
- 95% confidence interval
- -0.5189 to -0.3153
- Granger causality
- None
- Granger optimal lag
- 10
- Time coverage
- 2010-01-04 to 2010-12-31
- Recomputed on refreshed data
- 2026-10-22 (r was -0.4224)
AI analysis
Analysis: Brent Crude Oil Price vs. Cboe Tape B Notional Volume (2010)
Relationship Overview The scatterplot reveals a moderate negative relationship between daily Brent crude oil prices (X-axis, USD/barrel) and Cboe Tape B notional trading volume (Y-axis). As oil prices increase, equity market notional volume on Tape B exchanges tends to decline. The linear regression equation (y = -1.477×10⁸x + 1.692×10¹⁰) quantifies this inverse slope, suggesting that each additional dollar per barrel in crude price is associated with approximately $147.7 million less in daily notional trading volume. However, the scatter is wide, and the relationship is far from deterministic, with considerable dispersion across the entire price range.
Correlation Strength and Statistical Significance The Pearson correlation of r = -0.4224 indicates a moderate negative association, but the explanatory power is modest: r² = 0.1785 means only ~17.8% of variance in notional volume is explained by crude oil price levels, leaving over 82% attributable to other factors. The 95% confidence interval of [-0.5189, -0.3153] is entirely negative, confirming directional consistency, and the p-value of 2.5×10⁻¹² establishes that this is highly unlikely to be a chance finding given n = 252 observations. That said, statistical significance here is partly a function of sample size and should not be conflated with practical or economic significance. Critically, Granger causality tests in both directions fail to reach significance (X→Y: p = 0.6704; Y→X: p = 0.3479), meaning neither variable temporally predicts the other in a lagged framework — the correlation does not reflect a predictive lead-lag dynamic, even at the optimal 10-period lag.
Notable Patterns, Clusters, and Outliers Several features stand out in the data. The bulk of observations cluster in the oil price range of 74–87 USD/barrel with notional volumes of 3–7 billion USD, forming a relatively dense core. However, there are prominent high-volume outliers — notably points near (76.48, ~15.1B), (75.12, ~9.1B), (76.43, ~8.8B), and (70.45, ~11.8B) — that sit far above the regression line and exert disproportionate influence on the overall scatter. At the lower oil price range (67–74 USD/barrel), volume values are more variable and tend to be elevated, which drives much of the negative slope. At the higher end (88–94 USD/barrel), volume observations are consistently lower and less dispersed, suggesting a ceiling effect or reduced market activity during high-price periods. The relationship also appears somewhat non-linear, with high variance at low prices compressing toward lower variance at high prices — a pattern consistent with heteroscedasticity.
Confounding Factors and Caveats Several important caveats apply. First, 2010 was a specific macro-recovery period following the 2008-2009 financial crisis, with unusual cross-asset dynamics that may not generalize. Second, Tape B notional volume reflects activity on specific regional exchanges (e.g., NYSE Arca, NYSE American), not total market volume, limiting its representativeness. Third, the correlation may reflect shared sensitivity to a common third driver — such as macroeconomic risk appetite, the USD index, or broad equity market conditions — rather than any direct crude-equity link. High oil prices in 2010 often coincided with risk-on periods where certain trading behaviors shifted. Finally, daily data introduces autocorrelation within both series, which can inflate apparent correlation significance even after adjusting for sample size.
Actionable Insights and Further Investigation Given the weak explanatory power and absent Granger causality, practitioners should not use Brent crude prices as a standalone predictor of Tape B notional volume. However, the consistent negative directionality warrants further exploration: controlling for VIX, USD strength, and S&P 500 returns in a multivariate regression would help isolate whether the crude-volume relationship survives after accounting for broader risk regime factors. Investigating the high-volume outlier dates specifically could reveal whether they correspond to identifiable market events (e.g., flash crash aftershocks, OPEC announcements) that distort the relationship. Extending the analysis across multiple years would test whether this 2010-specific pattern is structural or coincidental, and applying rolling correlation windows could reveal whether the relationship strengthens or reverses during different oil price regimes.
X dataset: Brent Crude Oil Prices: Daily (DCOILBRENTEU) – FRED St. Louis Fed
Y dataset: Cboe U.S. Equities Historical Market Volume Data 2010
Part of experiment: Daily - Brent Crude Oil Prices: Daily (DCOILBRENTEU) – FRED St. Louis Fed vs Cboe U.S. Equities Historical Market Volume Data 2010