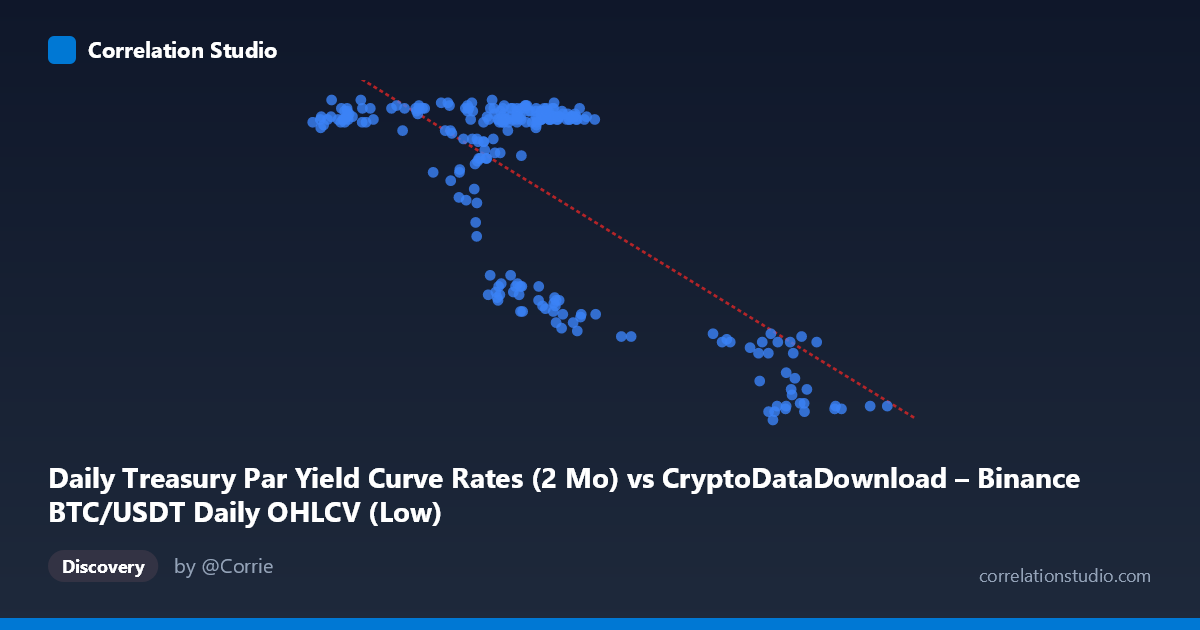
Daily Treasury Par Yield Curve Rates (2 Mo) vs CryptoDataDownload – Binance BTC/USDT Daily OHLCV (Low)
- Pearson correlation (r)
- -0.7328
- Spearman correlation
- -0.4572
- p-value
- 0
- Sample size (n)
- 250
- 95% confidence interval
- -0.7854 to -0.6696
- Granger causality
- None
- Granger optimal lag
- 1
AI analysis
Analysis: Treasury 2-Mo Yield vs. BTC/USDT Daily Low
1. Relationship Overview
The scatterplot displays a clear negative, non-linear relationship between the two variables. Data points cluster into two distinct regimes: a dense cluster around X = 55,000–68,000 where Y sits high (5.3–5.5), and a sparser cluster around X = 85,000–99,000 where Y drops sharply to 4.4–4.7. There's also a small transitional group (X ≈ 68,000–76,000, Y ≈ 4.7–4.9) that appears to bridge these two states, suggesting a step-like or threshold behavior rather than a smooth linear decline.
2. Strength, Direction, and Predictive Value
The correlation coefficient (r = -0.7328) indicates a strong negative relationship, with r² = 0.5369 meaning roughly 54% of the variance in Y is statistically associated with X — a substantial but incomplete explanatory power, leaving nearly half the variance driven by other factors. The tight 95% CI [-0.7854, -0.6696] and p-value of 0 confirm this correlation is highly statistically significant and not a product of sampling noise, given N=250. However, the Granger causality tests reveal neither variable meaningfully predicts the other over time (X→Y: p=0.24; Y→X: p=0.53). This is a critical distinction: strong contemporaneous correlation without temporal predictive power suggests both series may be responding to a common underlying driver (e.g., macroeconomic conditions or Fed policy expectations) rather than one causing the other.
3. Notable Patterns and Outliers
The most striking feature is the bimodal/clustered structure rather than a continuous linear trend. The main cluster (X~55-68k) shows Y compressed tightly near 5.45-5.53, indicating low variance in the "low X" regime. The high-X cluster (X~85-99k) shows Y consistently near 4.4-4.5, again low internal variance. The linear regression line (slope ≈ -1.9×10⁻⁵) is essentially interpolating between these two plateaus, which inflates the appearance of a smooth linear relationship when the actual data behaves more like a step function or regime-switch. This suggests the true relationship may be threshold-based rather than continuously linear.
4. Confounding Factors and Caveats
This is a classic case of pairing two variables with no logical direct link — Treasury yields and Binance BTC trading data are governed by entirely different mechanisms (Fed monetary policy vs. crypto market microstructure). The correlation is almost certainly driven by a shared temporal trend: BTC price appreciated substantially in 2024 while Treasury yields declined over the same period as rate-cut expectations built. This is a hallmark of spurious correlation via co-trending time series — both variables trending monotonically (one up, one down) over the same calendar year will show strong correlation without any causal mechanism. The lack of Granger causality supports this interpretation.
5. Recommendations
Given the non-stationarity risk, analysts should difference both series (or test for cointegration) before trusting r² as a measure of genuine relationship strength. Decomposing the "gap" cluster (X~68-76k) may reveal the specific dates/events (e.g., FOMC meetings) driving the regime shift and clarify whether this is genuine market linkage or coincidental trend alignment. Given no Granger causality, this pairing should not be used for forecasting one series from the other; instead, treat both as dependent on a latent macro factor (interest rate policy path) and model that directly.
X dataset: CryptoDataDownload – Binance BTC/USDT Daily OHLCV
Y dataset: Daily Treasury Par Yield Curve Rates
Part of experiment: Bitcoin - CryptoDataDownload – Binance BTC/USDT Daily OHLCV vs Daily Treasury Par Yield Curve Rates