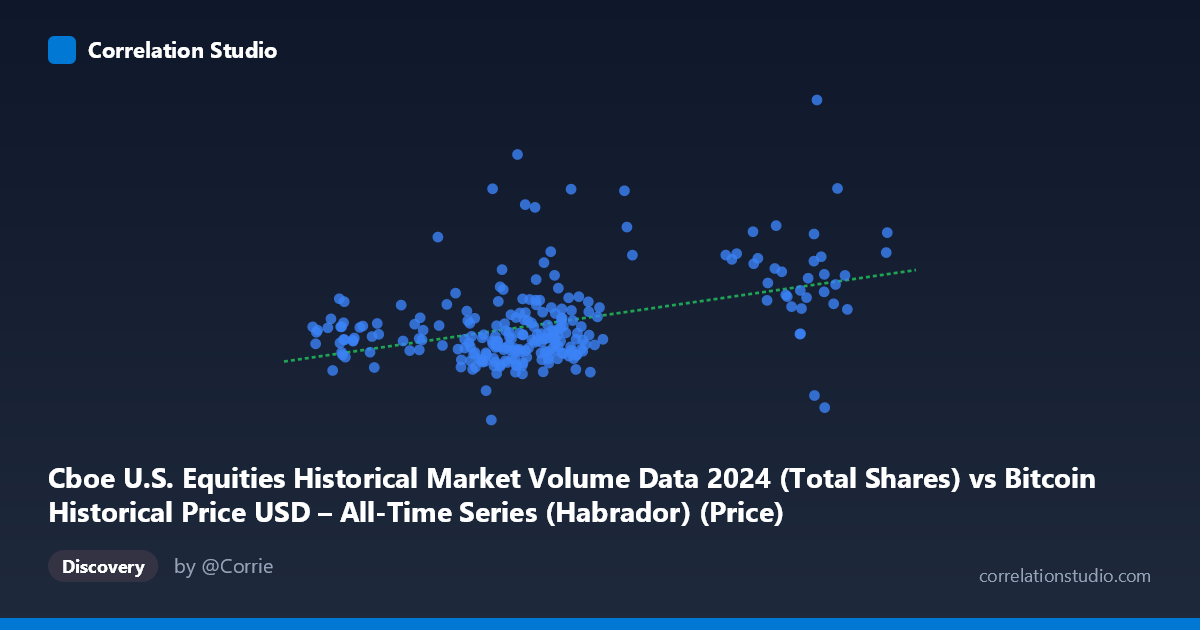
Cboe U.S. Equities Historical Market Volume Data 2024 (Total Shares) vs Bitcoin Historical Price USD – All-Time Series (Habrador) (Price)
- Pearson correlation (r)
- 0.4269
- Spearman correlation
- 0.3415
- p-value
- 0
- Sample size (n)
- 252
- 95% confidence interval
- 0.3202 to 0.5229
- Granger causality
- None
- Granger optimal lag
- 10
- Time coverage
- 2024-01-02 to 2024-12-31
AI analysis
Analysis: Cboe U.S. Equities Volume vs. Bitcoin Price (2024)
1. Overview of the Relationship
The scatterplot shows a positive but noisy relationship between Cboe U.S. equities trading volume (X) and Bitcoin price (Y) across 252 paired daily observations in 2024. The data forms a loose, upward-sloping cloud rather than a tight linear band, with the majority of points clustered in the X range of 55,000–72,000 shares and Y range of roughly 500M–800M USD. A secondary, sparser group of points appears at higher X values (96,000–101,000), also trending toward higher Y values (700M–825M), which contributes disproportionately to the apparent slope.
2. Strength, Direction, and Statistical Confidence
The correlation coefficient (r = 0.427) indicates a moderate positive relationship, but r² = 0.182 reveals that only 18.2% of the variance in Bitcoin price is explained by equities volume — meaning over 80% of Bitcoin's price movement is driven by other factors entirely. The 95% CI [0.320, 0.523] is reasonably tight and excludes zero, and the p-value (1.385E-12) confirms this correlation is highly statistically significant and not due to chance. However, statistical significance with a large sample should not be conflated with practical predictive power — r² remains modest. Critically, the Granger causality tests show no significant predictive direction in either direction (X→Y: p=0.214; Y→X: p=0.849) at the optimal lag of 10 periods. This means neither variable reliably precedes or forecasts the other in time — the correlation appears to be contemporaneous/coincidental rather than a lead-lag relationship, undermining any causal or forecasting narrative.
3. Patterns, Clusters, and Outliers
Two visible clusters emerge: a dense main cluster (X: 55k–72k) and a smaller, distinct cluster at higher volumes (X: 96k–101k) that all correspond to elevated Bitcoin prices (700M–825M) — though one point at X=98,750 has an unusually low Y (413M), a distinct outlier breaking the pattern. Within the main cluster, there is substantial vertical scatter — at X≈65,000, Y ranges from ~555M to ~965M, showing volume alone poorly constrains price at that level. A few Y-outliers exist (e.g., 965M at X=64,096; 877M at X=53,991; 379M at X=60,174) that don't fit the general trend and may disproportionately influence the regression slope.
4. Confounding Factors and Caveats
Both series likely share a common confound: macroeconomic conditions and market-wide risk sentiment in 2024 (rate expectations, liquidity cycles, ETF-driven flows) could simultaneously drive both equities trading activity and Bitcoin price without one causing the other. Additionally, aggregating "Total Shares" volume across all Cboe equities is a very indirect proxy for crypto-relevant capital flows — the mechanism linking these variables is not obvious. The bimodal X-distribution (a large cluster plus a smaller high-volume cluster) may also be inflating the linear correlation by anchoring two separated groups rather than reflecting a smooth linear relationship.
5. Suggested Next Steps
Given the lack of Granger causality, this relationship should be treated as spurious or confounded rather than predictive — it should not be used for trading signals or forecasting. Further investigation should: (a) test both series against known common drivers (e.g., DXY, Fed policy dates, VIX) to identify shared confounders, (b) examine whether the high-volume cluster (96k–101k) corresponds to specific calendar events (e.g., quad-witching, rebalancing days) that could explain the apparent slope, (c) investigate the 98,750/413M outlier specifically, and (d) consider non-linear or lagged cross-correlation analysis beyond the linear/Granger framework, since equities volume and BTC price may interact through more complex, event-driven channels rather than a stable linear one.
X dataset: Bitcoin Historical Price USD – All-Time Series (Habrador)
Y dataset: Cboe U.S. Equities Historical Market Volume Data 2024
Part of experiment: Bitcoin - Bitcoin Historical Price USD – All-Time Series (Habrador) vs Cboe U.S. Equities Historical Market Volume Data 2024